Data
87,996 items of data are available, covering 83,313 participants.
Defined-instances run from 2 to 3, labelled using Instancing
2.
Units of measurement are mm.
| Maximum | 3.641 |
| Decile 9 | 3.208 |
| Decile 8 | 3.146 |
| Decile 7 | 3.102 |
| Decile 6 | 3.063 |
| Median | 3.027 |
| Decile 4 | 2.991 |
| Decile 3 | 2.951 |
| Decile 2 | 2.903 |
| Decile 1 | 2.834 |
| Minimum | 1.644 |
|
|
- Mean = 3.0232
- Std.dev = 0.148204
- 53 items below graph minimum of 2.46
- 1 item above graph maximum of 3.582
|
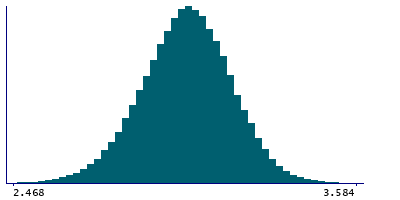
2 Instances
Instance 2 : Imaging visit (2014+)
83,241 participants, 83,241 items
| Maximum | 3.641 |
| Decile 9 | 3.208 |
| Decile 8 | 3.146 |
| Decile 7 | 3.102 |
| Decile 6 | 3.063 |
| Median | 3.027 |
| Decile 4 | 2.99 |
| Decile 3 | 2.95 |
| Decile 2 | 2.902 |
| Decile 1 | 2.833 |
| Minimum | 1.808 |
|

|
- Mean = 3.02262
- Std.dev = 0.14845
- 49 items below graph minimum of 2.458
- 1 item above graph maximum of 3.583
|
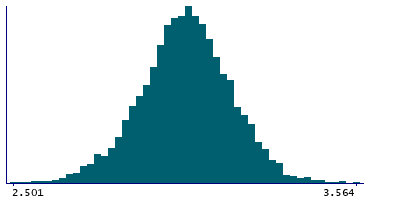
Instance 3 : First repeat imaging visit (2019+)
4,755 participants, 4,755 items
| Maximum | 3.564 |
| Decile 9 | 3.211 |
| Decile 8 | 3.149 |
| Decile 7 | 3.105 |
| Decile 6 | 3.069 |
| Median | 3.037 |
| Decile 4 | 3.002 |
| Decile 3 | 2.967 |
| Decile 2 | 2.921 |
| Decile 1 | 2.856 |
| Minimum | 1.644 |
|
|
- Mean = 3.03329
- Std.dev = 0.143446
- 4 items below graph minimum of 2.501
|
Notes
Mean thickness of inferiortemporal in the left hemisphere generated by parcellation of the white surface using DKT parcellation
0 Related Data-Fields
There are no related data-fields
0 Resources
There are no matching Resources
