Data
87,996 items of data are available, covering 83,313 participants.
Defined-instances run from 2 to 3, labelled using Instancing
2.
Units of measurement are mm.
| Maximum | 3.728 |
| Decile 9 | 3.032 |
| Decile 8 | 2.969 |
| Decile 7 | 2.924 |
| Decile 6 | 2.883 |
| Median | 2.845 |
| Decile 4 | 2.806 |
| Decile 3 | 2.763 |
| Decile 2 | 2.71 |
| Decile 1 | 2.633 |
| Minimum | 1.806 |
|
|
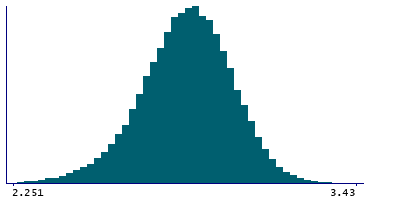
- Mean = 2.83722
- Std.dev = 0.159188
- 88 items below graph minimum of 2.234
- 6 items above graph maximum of 3.431
|
2 Instances
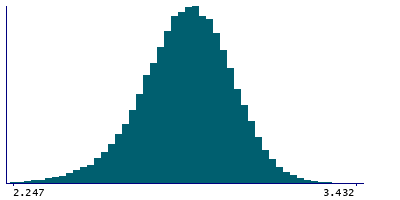
Instance 2 : Imaging visit (2014+)
83,241 participants, 83,241 items
| Maximum | 3.728 |
| Decile 9 | 3.031 |
| Decile 8 | 2.969 |
| Decile 7 | 2.923 |
| Decile 6 | 2.883 |
| Median | 2.844 |
| Decile 4 | 2.805 |
| Decile 3 | 2.762 |
| Decile 2 | 2.709 |
| Decile 1 | 2.631 |
| Minimum | 1.974 |
|
|
- Mean = 2.83612
- Std.dev = 0.159669
- 84 items below graph minimum of 2.231
- 5 items above graph maximum of 3.431
|
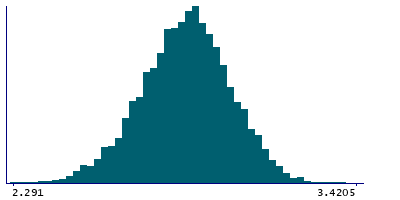
Instance 3 : First repeat imaging visit (2019+)
4,755 participants, 4,755 items
| Maximum | 3.648 |
| Decile 9 | 3.044 |
| Decile 8 | 2.981 |
| Decile 7 | 2.935 |
| Decile 6 | 2.897 |
| Median | 2.8625 |
| Decile 4 | 2.824 |
| Decile 3 | 2.785 |
| Decile 2 | 2.735 |
| Decile 1 | 2.6675 |
| Minimum | 1.806 |
|
|
- Mean = 2.85648
- Std.dev = 0.149222
- 3 items below graph minimum of 2.291
- 1 item above graph maximum of 3.4205
|
Notes
Mean thickness of parsopercularis in the left hemisphere generated by parcellation of the white surface using DKT parcellation
0 Related Data-Fields
There are no related data-fields
0 Resources
There are no matching Resources
