Data
87,996 items of data are available, covering 83,313 participants.
Defined-instances run from 2 to 3, labelled using Instancing
2.
Units of measurement are mm.
| Maximum | 3.057 |
| Decile 9 | 2.625 |
| Decile 8 | 2.569 |
| Decile 7 | 2.526 |
| Decile 6 | 2.49 |
| Median | 2.454 |
| Decile 4 | 2.418 |
| Decile 3 | 2.378 |
| Decile 2 | 2.328 |
| Decile 1 | 2.252 |
| Minimum | 1.615 |
|
|
- Mean = 2.44517
- Std.dev = 0.148888
- 72 items below graph minimum of 1.879
- 2 items above graph maximum of 2.998
|
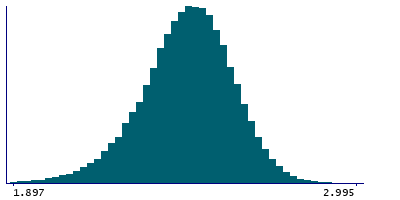
2 Instances
Instance 2 : Imaging visit (2014+)
83,241 participants, 83,241 items
| Maximum | 3.057 |
| Decile 9 | 2.625 |
| Decile 8 | 2.568 |
| Decile 7 | 2.526 |
| Decile 6 | 2.489 |
| Median | 2.453 |
| Decile 4 | 2.417 |
| Decile 3 | 2.376 |
| Decile 2 | 2.326 |
| Decile 1 | 2.251 |
| Minimum | 1.688 |
|

|
- Mean = 2.44407
- Std.dev = 0.149323
- 66 items below graph minimum of 1.877
- 1 item above graph maximum of 2.999
|
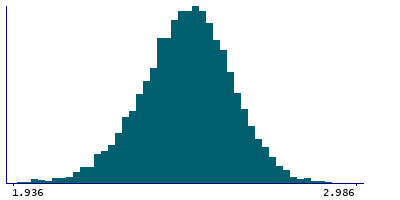
Instance 3 : First repeat imaging visit (2019+)
4,755 participants, 4,755 items
| Maximum | 3.007 |
| Decile 9 | 2.636 |
| Decile 8 | 2.579 |
| Decile 7 | 2.538 |
| Decile 6 | 2.504 |
| Median | 2.471 |
| Decile 4 | 2.436 |
| Decile 3 | 2.398 |
| Decile 2 | 2.354 |
| Decile 1 | 2.286 |
| Minimum | 1.615 |
|
|
- Mean = 2.46453
- Std.dev = 0.139635
- 6 items below graph minimum of 1.936
- 1 item above graph maximum of 2.986
|
Notes
Mean thickness of superiorparietal in the left hemisphere generated by parcellation of the white surface using DKT parcellation
0 Related Data-Fields
There are no related data-fields
0 Resources
There are no matching Resources
