Data
87,996 items of data are available, covering 83,313 participants.
Defined-instances run from 2 to 3, labelled using Instancing
2.
Units of measurement are mm.
| Maximum | 3.489 |
| Decile 9 | 2.967 |
| Decile 8 | 2.908 |
| Decile 7 | 2.865 |
| Decile 6 | 2.827 |
| Median | 2.79 |
| Decile 4 | 2.752 |
| Decile 3 | 2.71 |
| Decile 2 | 2.659 |
| Decile 1 | 2.58 |
| Minimum | 1.861 |
|
|
- Mean = 2.7799
- Std.dev = 0.15434
- 90 items below graph minimum of 2.193
- 3 items above graph maximum of 3.354
|
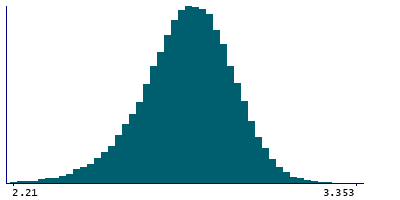
2 Instances
Instance 2 : Imaging visit (2014+)
83,241 participants, 83,241 items
| Maximum | 3.489 |
| Decile 9 | 2.966 |
| Decile 8 | 2.907 |
| Decile 7 | 2.864 |
| Decile 6 | 2.826 |
| Median | 2.789 |
| Decile 4 | 2.751 |
| Decile 3 | 2.709 |
| Decile 2 | 2.657 |
| Decile 1 | 2.578 |
| Minimum | 1.861 |
|

|
- Mean = 2.77875
- Std.dev = 0.154793
- 81 items below graph minimum of 2.19
- 2 items above graph maximum of 3.354
|
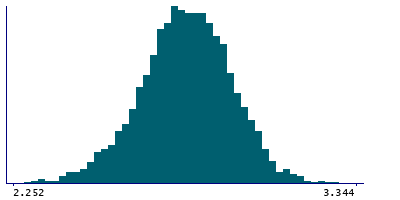
Instance 3 : First repeat imaging visit (2019+)
4,755 participants, 4,755 items
| Maximum | 3.376 |
| Decile 9 | 2.98 |
| Decile 8 | 2.92 |
| Decile 7 | 2.878 |
| Decile 6 | 2.84 |
| Median | 2.805 |
| Decile 4 | 2.768 |
| Decile 3 | 2.731 |
| Decile 2 | 2.685 |
| Decile 1 | 2.616 |
| Minimum | 1.957 |
|
|
- Mean = 2.7999
- Std.dev = 0.144727
- 8 items below graph minimum of 2.252
- 1 item above graph maximum of 3.344
|
Notes
Mean thickness of supramarginal in the left hemisphere generated by parcellation of the white surface using DKT parcellation
0 Related Data-Fields
There are no related data-fields
0 Resources
There are no matching Resources
