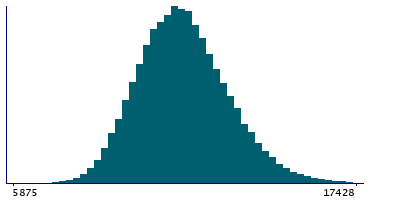
Data
87,996 items of data are available, covering 83,313 participants.
Defined-instances run from 2 to 3, labelled using Instancing
2.
Units of measurement are mm3.
| Maximum | 21394 |
| Decile 9 | 13514 |
| Decile 8 | 12766 |
| Decile 7 | 12245 |
| Decile 6 | 11824 |
| Median | 11447 |
| Decile 4 | 11076 |
| Decile 3 | 10682 |
| Decile 2 | 10254 |
| Decile 1 | 9672 |
| Minimum | 5042 |
|
|
- Mean = 11535.1
- Std.dev = 1515.81
- 2 items below graph minimum of 5830
- 54 items above graph maximum of 17356
|
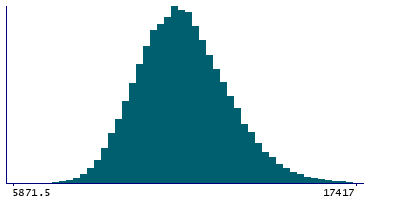
2 Instances
Instance 2 : Imaging visit (2014+)
83,241 participants, 83,241 items
| Maximum | 21394 |
| Decile 9 | 13500 |
| Decile 8 | 12757 |
| Decile 7 | 12237.5 |
| Decile 6 | 11814 |
| Median | 11438 |
| Decile 4 | 11068 |
| Decile 3 | 10674 |
| Decile 2 | 10245 |
| Decile 1 | 9664 |
| Minimum | 5042 |
|
|
- Mean = 11526
- Std.dev = 1514.21
- 2 items below graph minimum of 5828
- 52 items above graph maximum of 17336
|
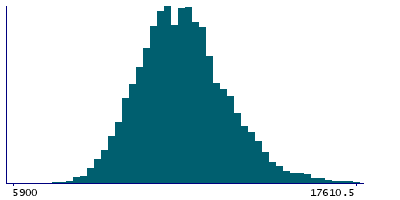
Instance 3 : First repeat imaging visit (2019+)
4,755 participants, 4,755 items
| Maximum | 18405 |
| Decile 9 | 13707 |
| Decile 8 | 12921 |
| Decile 7 | 12381.5 |
| Decile 6 | 11980 |
| Median | 11608 |
| Decile 4 | 11197 |
| Decile 3 | 10842 |
| Decile 2 | 10411 |
| Decile 1 | 9803.5 |
| Minimum | 5871 |
|
|
- Mean = 11693.7
- Std.dev = 1534.99
- 1 item below graph minimum of 5900
- 4 items above graph maximum of 17610.5
|
Notes
Volume of postcentral in the left hemisphere generated by parcellation of the white surface using DKT parcellation
0 Related Data-Fields
There are no related data-fields
0 Resources
There are no matching Resources
