Data
87,996 items of data are available, covering 83,313 participants.
Defined-instances run from 2 to 3, labelled using Instancing
2.
Units of measurement are mm3.
| Maximum | 2909 |
| Decile 9 | 1533 |
| Decile 8 | 1415 |
| Decile 7 | 1335 |
| Decile 6 | 1269 |
| Median | 1212 |
| Decile 4 | 1155 |
| Decile 3 | 1099 |
| Decile 2 | 1037 |
| Decile 1 | 957 |
| Minimum | 288 |
|

|
- Mean = 1232.01
- Std.dev = 228.781
- 135 items above graph maximum of 2109
|
2 Instances
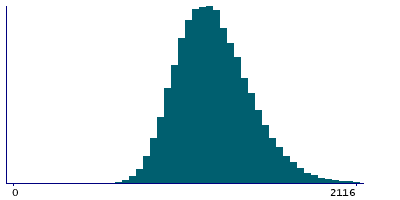
Instance 2 : Imaging visit (2014+)
83,241 participants, 83,241 items
| Maximum | 2909 |
| Decile 9 | 1531 |
| Decile 8 | 1414 |
| Decile 7 | 1334 |
| Decile 6 | 1268 |
| Median | 1211 |
| Decile 4 | 1155 |
| Decile 3 | 1099 |
| Decile 2 | 1037 |
| Decile 1 | 956 |
| Minimum | 288 |
|
|
- Mean = 1231.23
- Std.dev = 228.47
- 124 items above graph maximum of 2106
|
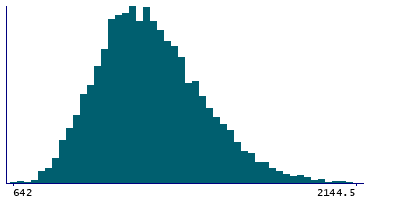
Instance 3 : First repeat imaging visit (2019+)
4,755 participants, 4,755 items
| Maximum | 2488 |
| Decile 9 | 1554.5 |
| Decile 8 | 1433 |
| Decile 7 | 1349.5 |
| Decile 6 | 1281 |
| Median | 1223 |
| Decile 4 | 1165 |
| Decile 3 | 1108.5 |
| Decile 2 | 1050 |
| Decile 1 | 965 |
| Minimum | 642 |
|
|
- Mean = 1245.59
- Std.dev = 233.74
- 11 items above graph maximum of 2144
|
Notes
Volume of transversetemporal in the left hemisphere generated by parcellation of the white surface using DKT parcellation
0 Related Data-Fields
There are no related data-fields
0 Resources
There are no matching Resources
