Data
87,996 items of data are available, covering 83,313 participants.
Defined-instances run from 2 to 3, labelled using Instancing
2.
Units of measurement are mm2.
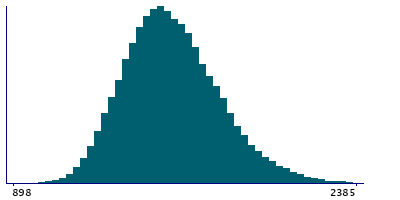
| Maximum | 3597 |
| Decile 9 | 1855 |
| Decile 8 | 1751 |
| Decile 7 | 1678 |
| Decile 6 | 1619 |
| Median | 1566 |
| Decile 4 | 1516 |
| Decile 3 | 1464 |
| Decile 2 | 1407 |
| Decile 1 | 1330 |
| Minimum | 898 |
|
|
- Mean = 1583.33
- Std.dev = 207.781
- 94 items above graph maximum of 2380
|
2 Instances
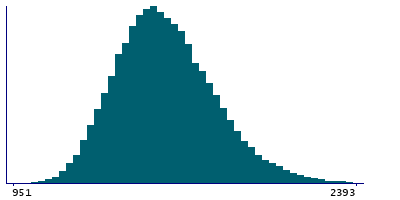
Instance 2 : Imaging visit (2014+)
83,241 participants, 83,241 items
| Maximum | 3597 |
| Decile 9 | 1855 |
| Decile 8 | 1750 |
| Decile 7 | 1677 |
| Decile 6 | 1619 |
| Median | 1566 |
| Decile 4 | 1515 |
| Decile 3 | 1464 |
| Decile 2 | 1406 |
| Decile 1 | 1330 |
| Minimum | 898 |
|
|
- Mean = 1582.81
- Std.dev = 207.754
- 88 items above graph maximum of 2380
|
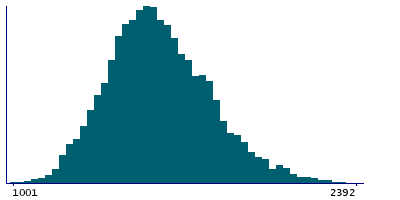
Instance 3 : First repeat imaging visit (2019+)
4,755 participants, 4,755 items
| Maximum | 2618 |
| Decile 9 | 1865 |
| Decile 8 | 1766 |
| Decile 7 | 1688 |
| Decile 6 | 1627 |
| Median | 1575 |
| Decile 4 | 1525 |
| Decile 3 | 1475 |
| Decile 2 | 1418 |
| Decile 1 | 1338 |
| Minimum | 1001 |
|
|
- Mean = 1592.4
- Std.dev = 208.046
- 6 items above graph maximum of 2392
|
Notes
Area of paracentral in the right hemisphere generated by parcellation of the white surface using DKT parcellation
0 Related Data-Fields
There are no related data-fields
0 Resources
There are no matching Resources
