Data
87,996 items of data are available, covering 83,313 participants.
Defined-instances run from 2 to 3, labelled using Instancing
2.
Units of measurement are mm2.
| Maximum | 8762 |
| Decile 9 | 5172 |
| Decile 8 | 4933 |
| Decile 7 | 4764 |
| Decile 6 | 4628 |
| Median | 4504 |
| Decile 4 | 4383 |
| Decile 3 | 4259 |
| Decile 2 | 4121 |
| Decile 1 | 3935 |
| Minimum | 2712 |
|
|
- Mean = 4534.79
- Std.dev = 487.94
- 86 items above graph maximum of 6409
|
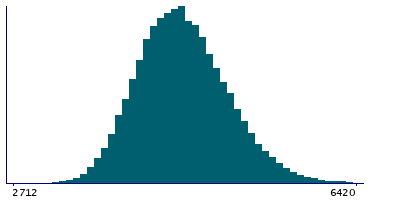
2 Instances
Instance 2 : Imaging visit (2014+)
83,241 participants, 83,241 items
| Maximum | 8762 |
| Decile 9 | 5173 |
| Decile 8 | 4933 |
| Decile 7 | 4764 |
| Decile 6 | 4627 |
| Median | 4504 |
| Decile 4 | 4382 |
| Decile 3 | 4257 |
| Decile 2 | 4120 |
| Decile 1 | 3934 |
| Minimum | 2712 |
|

|
- Mean = 4534.01
- Std.dev = 488.511
- 80 items above graph maximum of 6412
|
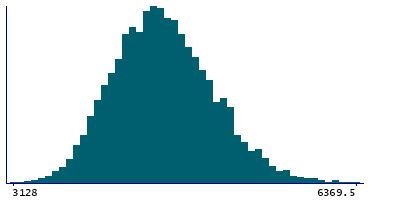
Instance 3 : First repeat imaging visit (2019+)
4,755 participants, 4,755 items
| Maximum | 7355 |
| Decile 9 | 5164.5 |
| Decile 8 | 4940 |
| Decile 7 | 4773 |
| Decile 6 | 4642 |
| Median | 4522 |
| Decile 4 | 4404 |
| Decile 3 | 4277 |
| Decile 2 | 4144 |
| Decile 1 | 3960.5 |
| Minimum | 3128 |
|
|
- Mean = 4548.3
- Std.dev = 477.632
- 6 items above graph maximum of 6368.5
|
Notes
Area of precentral in the right hemisphere generated by parcellation of the white surface using DKT parcellation
0 Related Data-Fields
There are no related data-fields
0 Resources
There are no matching Resources
