Data
87,996 items of data are available, covering 83,313 participants.
Defined-instances run from 2 to 3, labelled using Instancing
2.
Units of measurement are mm.
| Maximum | 2.659 |
| Decile 9 | 1.897 |
| Decile 8 | 1.832 |
| Decile 7 | 1.785 |
| Decile 6 | 1.744 |
| Median | 1.707 |
| Decile 4 | 1.67 |
| Decile 3 | 1.631 |
| Decile 2 | 1.585 |
| Decile 1 | 1.525 |
| Minimum | 1.148 |
|
|
- Mean = 1.71006
- Std.dev = 0.145459
- 1 item below graph minimum of 1.153
- 19 items above graph maximum of 2.269
|
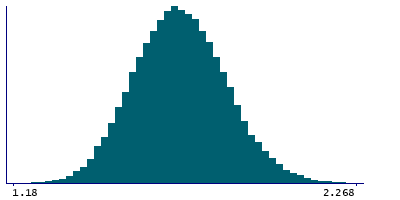
2 Instances
Instance 2 : Imaging visit (2014+)
83,241 participants, 83,241 items
| Maximum | 2.659 |
| Decile 9 | 1.897 |
| Decile 8 | 1.832 |
| Decile 7 | 1.784 |
| Decile 6 | 1.744 |
| Median | 1.706 |
| Decile 4 | 1.67 |
| Decile 3 | 1.631 |
| Decile 2 | 1.585 |
| Decile 1 | 1.525 |
| Minimum | 1.148 |
|

|
- Mean = 1.7098
- Std.dev = 0.145552
- 1 item below graph minimum of 1.153
- 18 items above graph maximum of 2.269
|
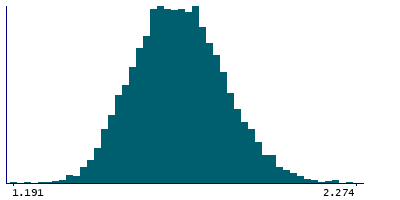
Instance 3 : First repeat imaging visit (2019+)
4,755 participants, 4,755 items
| Maximum | 2.34 |
| Decile 9 | 1.903 |
| Decile 8 | 1.835 |
| Decile 7 | 1.787 |
| Decile 6 | 1.749 |
| Median | 1.71 |
| Decile 4 | 1.671 |
| Decile 3 | 1.635 |
| Decile 2 | 1.591 |
| Decile 1 | 1.532 |
| Minimum | 1.191 |
|
|
- Mean = 1.71465
- Std.dev = 0.143748
- 1 item above graph maximum of 2.274
|
Notes
Mean thickness of pericalcarine in the right hemisphere generated by parcellation of the white surface using DKT parcellation
0 Related Data-Fields
There are no related data-fields
0 Resources
There are no matching Resources
