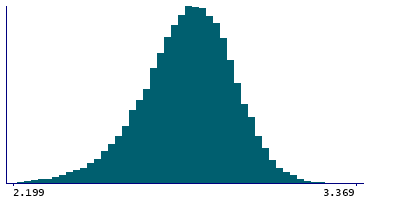
Data
87,996 items of data are available, covering 83,313 participants.
Defined-instances run from 2 to 3, labelled using Instancing
2.
Units of measurement are mm.
| Maximum | 3.629 |
| Decile 9 | 2.973 |
| Decile 8 | 2.914 |
| Decile 7 | 2.87 |
| Decile 6 | 2.831 |
| Median | 2.793 |
| Decile 4 | 2.754 |
| Decile 3 | 2.71 |
| Decile 2 | 2.656 |
| Decile 1 | 2.575 |
| Minimum | 1.627 |
|
|
- Mean = 2.7816
- Std.dev = 0.158659
- 121 items below graph minimum of 2.177
- 3 items above graph maximum of 3.371
|
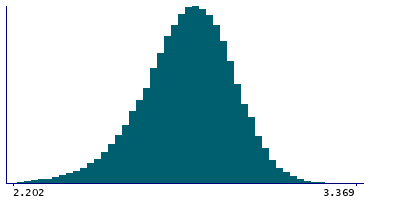
2 Instances
Instance 2 : Imaging visit (2014+)
83,241 participants, 83,241 items
| Maximum | 3.629 |
| Decile 9 | 2.972 |
| Decile 8 | 2.913 |
| Decile 7 | 2.869 |
| Decile 6 | 2.83 |
| Median | 2.792 |
| Decile 4 | 2.753 |
| Decile 3 | 2.709 |
| Decile 2 | 2.655 |
| Decile 1 | 2.573 |
| Minimum | 1.627 |
|
|
- Mean = 2.78044
- Std.dev = 0.15906
- 115 items below graph minimum of 2.174
- 3 items above graph maximum of 3.371
|
Instance 3 : First repeat imaging visit (2019+)
4,755 participants, 4,755 items
| Maximum | 3.339 |
| Decile 9 | 2.9865 |
| Decile 8 | 2.929 |
| Decile 7 | 2.881 |
| Decile 6 | 2.846 |
| Median | 2.811 |
| Decile 4 | 2.773 |
| Decile 3 | 2.732 |
| Decile 2 | 2.684 |
| Decile 1 | 2.608 |
| Minimum | 1.719 |
|

|
- Mean = 2.80193
- Std.dev = 0.150007
- 6 items below graph minimum of 2.2295
|
Notes
Mean thickness of supramarginal in the right hemisphere generated by parcellation of the white surface using DKT parcellation
0 Related Data-Fields
There are no related data-fields
0 Resources
There are no matching Resources
