Data
87,996 items of data are available, covering 83,313 participants.
Defined-instances run from 2 to 3, labelled using Instancing
2.
Units of measurement are mm.
| Maximum | 4.353 |
| Decile 9 | 3.696 |
| Decile 8 | 3.606 |
| Decile 7 | 3.54 |
| Decile 6 | 3.482 |
| Median | 3.428 |
| Decile 4 | 3.371 |
| Decile 3 | 3.308 |
| Decile 2 | 3.232 |
| Decile 1 | 3.12 |
| Minimum | 1.055 |
|
|
- Mean = 3.41437
- Std.dev = 0.232207
- 182 items below graph minimum of 2.544
- 3 items above graph maximum of 4.272
|
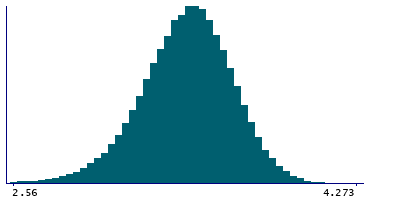
2 Instances
Instance 2 : Imaging visit (2014+)
83,241 participants, 83,241 items
| Maximum | 4.353 |
| Decile 9 | 3.695 |
| Decile 8 | 3.606 |
| Decile 7 | 3.539 |
| Decile 6 | 3.482 |
| Median | 3.427 |
| Decile 4 | 3.37 |
| Decile 3 | 3.307 |
| Decile 2 | 3.231 |
| Decile 1 | 3.118 |
| Minimum | 1.055 |
|

|
- Mean = 3.41354
- Std.dev = 0.232427
- 167 items below graph minimum of 2.541
- 3 items above graph maximum of 4.272
|
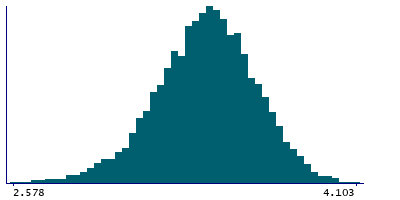
Instance 3 : First repeat imaging visit (2019+)
4,755 participants, 4,755 items
| Maximum | 4.103 |
| Decile 9 | 3.708 |
| Decile 8 | 3.616 |
| Decile 7 | 3.551 |
| Decile 6 | 3.493 |
| Median | 3.44 |
| Decile 4 | 3.386 |
| Decile 3 | 3.326 |
| Decile 2 | 3.251 |
| Decile 1 | 3.143 |
| Minimum | 1.406 |
|
|
- Mean = 3.42883
- Std.dev = 0.227838
- 9 items below graph minimum of 2.578
|
Notes
Mean thickness of Pole-temporal in the left hemisphere generated by parcellation of the white surface using Destrieux (a2009s) parcellation
0 Related Data-Fields
There are no related data-fields
0 Resources
There are no matching Resources
