Data
87,996 items of data are available, covering 83,313 participants.
Defined-instances run from 2 to 3, labelled using Instancing
2.
Units of measurement are mm.
| Maximum | 4.119 |
| Decile 9 | 2.745 |
| Decile 8 | 2.678 |
| Decile 7 | 2.629 |
| Decile 6 | 2.589 |
| Median | 2.55 |
| Decile 4 | 2.511 |
| Decile 3 | 2.469 |
| Decile 2 | 2.417 |
| Decile 1 | 2.344 |
| Minimum | 1.573 |
|
|
- Mean = 2.5466
- Std.dev = 0.160786
- 70 items below graph minimum of 1.943
- 36 items above graph maximum of 3.146
|
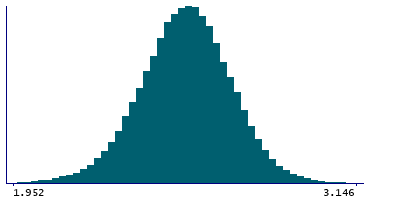
2 Instances
Instance 2 : Imaging visit (2014+)
83,241 participants, 83,241 items
| Maximum | 4.119 |
| Decile 9 | 2.745 |
| Decile 8 | 2.678 |
| Decile 7 | 2.629 |
| Decile 6 | 2.588 |
| Median | 2.549 |
| Decile 4 | 2.51 |
| Decile 3 | 2.468 |
| Decile 2 | 2.416 |
| Decile 1 | 2.342 |
| Minimum | 1.573 |
|

|
- Mean = 2.54599
- Std.dev = 0.16137
- 66 items below graph minimum of 1.939
- 33 items above graph maximum of 3.148
|
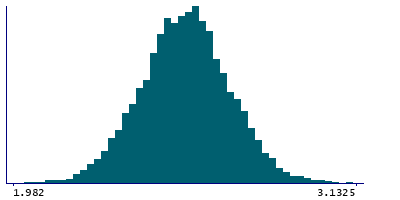
Instance 3 : First repeat imaging visit (2019+)
4,755 participants, 4,755 items
| Maximum | 3.161 |
| Decile 9 | 2.749 |
| Decile 8 | 2.68 |
| Decile 7 | 2.633 |
| Decile 6 | 2.595 |
| Median | 2.559 |
| Decile 4 | 2.52 |
| Decile 3 | 2.483 |
| Decile 2 | 2.435 |
| Decile 1 | 2.3655 |
| Minimum | 1.709 |
|
|
- Mean = 2.55729
- Std.dev = 0.149792
- 1 item below graph minimum of 1.982
- 1 item above graph maximum of 3.1325
|
Notes
Mean thickness of S-subparietal in the left hemisphere generated by parcellation of the white surface using Destrieux (a2009s) parcellation
0 Related Data-Fields
There are no related data-fields
0 Resources
There are no matching Resources
