Data
87,996 items of data are available, covering 83,313 participants.
Defined-instances run from 2 to 3, labelled using Instancing
2.
Units of measurement are mm.
| Maximum | 3.697 |
| Decile 9 | 2.865 |
| Decile 8 | 2.785 |
| Decile 7 | 2.73 |
| Decile 6 | 2.683 |
| Median | 2.639 |
| Decile 4 | 2.595 |
| Decile 3 | 2.547 |
| Decile 2 | 2.489 |
| Decile 1 | 2.405 |
| Minimum | 1.704 |
|
|
- Mean = 2.6367
- Std.dev = 0.184189
- 65 items below graph minimum of 1.945
- 37 items above graph maximum of 3.325
|
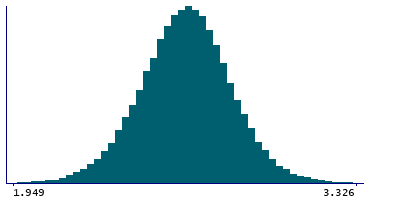
2 Instances
Instance 2 : Imaging visit (2014+)
83,241 participants, 83,241 items
| Maximum | 3.697 |
| Decile 9 | 2.864 |
| Decile 8 | 2.785 |
| Decile 7 | 2.729 |
| Decile 6 | 2.682 |
| Median | 2.639 |
| Decile 4 | 2.594 |
| Decile 3 | 2.546 |
| Decile 2 | 2.489 |
| Decile 1 | 2.405 |
| Minimum | 1.722 |
|

|
- Mean = 2.63627
- Std.dev = 0.18419
- 60 items below graph minimum of 1.946
- 36 items above graph maximum of 3.323
|
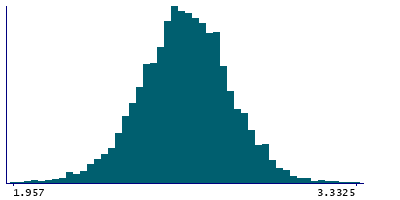
Instance 3 : First repeat imaging visit (2019+)
4,755 participants, 4,755 items
| Maximum | 3.519 |
| Decile 9 | 2.874 |
| Decile 8 | 2.789 |
| Decile 7 | 2.7385 |
| Decile 6 | 2.691 |
| Median | 2.646 |
| Decile 4 | 2.602 |
| Decile 3 | 2.556 |
| Decile 2 | 2.496 |
| Decile 1 | 2.416 |
| Minimum | 1.704 |
|
|
- Mean = 2.64418
- Std.dev = 0.18401
- 6 items below graph minimum of 1.958
- 1 item above graph maximum of 3.332
|
Notes
Mean thickness of S-temporal-inf in the right hemisphere generated by parcellation of the white surface using Destrieux (a2009s) parcellation
0 Related Data-Fields
There are no related data-fields
0 Resources
There are no matching Resources
