Data
90,479 items of data are available, covering 85,381 participants.
Defined-instances run from 2 to 3, labelled using Instancing
2.
Units of measurement are AU.
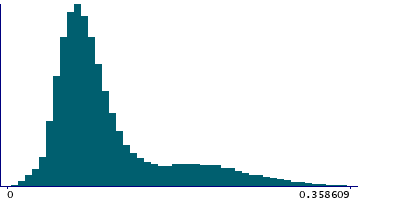
| Maximum | 0.449645 |
| Decile 9 | 0.205341 |
| Decile 8 | 0.141825 |
| Decile 7 | 0.109759 |
| Decile 6 | 0.0952374 |
| Median | 0.0853901 |
| Decile 4 | 0.0772062 |
| Decile 3 | 0.0696927 |
| Decile 2 | 0.0617959 |
| Decile 1 | 0.0520727 |
| Minimum | 0.00120218 |
|
|
- Mean = 0.105795
- Std.dev = 0.0613282
- 114 items above graph maximum of 0.358609
|
2 Instances
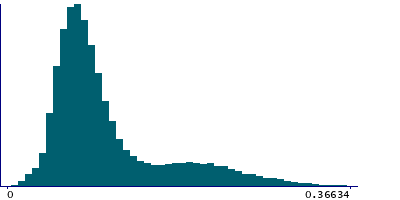
Instance 2 : Imaging visit (2014+)
85,291 participants, 85,291 items
| Maximum | 0.449645 |
| Decile 9 | 0.209055 |
| Decile 8 | 0.146858 |
| Decile 7 | 0.110458 |
| Decile 6 | 0.0952763 |
| Median | 0.085239 |
| Decile 4 | 0.0769603 |
| Decile 3 | 0.0694163 |
| Decile 2 | 0.0615194 |
| Decile 1 | 0.0517698 |
| Minimum | 0.00120218 |
|
|
- Mean = 0.106664
- Std.dev = 0.0626327
- 75 items above graph maximum of 0.36634
|
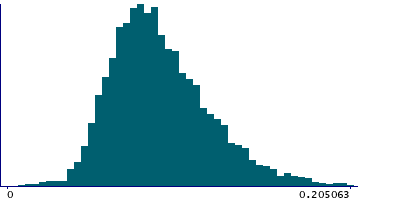
Instance 3 : First repeat imaging visit (2019+)
5,188 participants, 5,188 items
| Maximum | 0.265602 |
| Decile 9 | 0.131259 |
| Decile 8 | 0.114592 |
| Decile 7 | 0.103438 |
| Decile 6 | 0.0947078 |
| Median | 0.0873668 |
| Decile 4 | 0.0805288 |
| Decile 3 | 0.073936 |
| Decile 2 | 0.0668603 |
| Decile 1 | 0.057456 |
| Minimum | 0.00816565 |
|
|
- Mean = 0.0915126
- Std.dev = 0.0297714
- 6 items above graph maximum of 0.205063
|
Notes
Standard deviation of the X linear component of the dMRI eddy currents as calculated by FSL's eddy
0 Related Data-Fields
There are no related data-fields


