Data
500,754 samples are available, covering 485,538 participants.
Defined-instances run from 0 to 1, labelled using Instancing
2.
Units of measurement are microlitres.
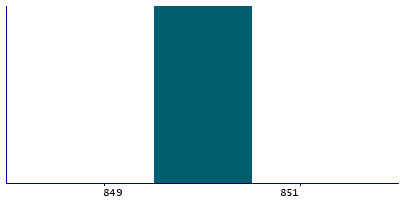
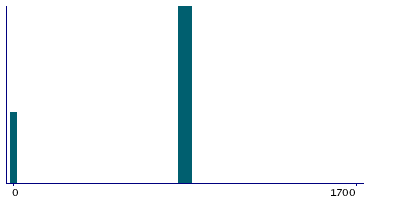
| Maximum | 1700 |
| Decile 9 | 850 |
| Decile 8 | 850 |
| Decile 7 | 850 |
| Decile 6 | 850 |
| Median | 850 |
| Decile 4 | 850 |
| Decile 3 | 850 |
| Decile 2 | 850 |
| Decile 1 | 850 |
| Minimum | 0 |
|
|
- There are 370 distinct values.
- Mean = 830.567
- Std.dev = 124.139
- 13753 items below graph minimum of 849
- 8 items above graph maximum of 851
|
2 Instances
Instance 0 : Initial assessment visit (2006-2010) at which participants were recruited and consent given
484,905 participants, 484,905 items
| Maximum | 1700 |
| Decile 9 | 850 |
| Decile 8 | 850 |
| Decile 7 | 850 |
| Decile 6 | 850 |
| Median | 850 |
| Decile 4 | 850 |
| Decile 3 | 850 |
| Decile 2 | 850 |
| Decile 1 | 850 |
| Minimum | 0 |
|

|
- There are 368 distinct values.
- Mean = 834.592
- Std.dev = 110.019
- 11047 items below graph minimum of 849
- 2 items above graph maximum of 851
|
Instance 1 : First repeat assessment visit (2012-13)
15,849 participants, 15,849 items
| Maximum | 1700 |
| Decile 9 | 850 |
| Decile 8 | 850 |
| Decile 7 | 850 |
| Decile 6 | 850 |
| Median | 850 |
| Decile 4 | 850 |
| Decile 3 | 850 |
| Decile 2 | 850 |
| Decile 1 | 0 |
| Minimum | 0 |
|
|
- There are 54 distinct values.
- Mean = 707.417
- Std.dev = 317.661
|
Notes
Volume held of "EDTA1 red cells" sample, obtained from UK Biobank assessment centre visits.
0 Related Data-Fields
There are no related data-fields
0 Resources
There are no matching Resources
