Data
486,926 items of data are available, covering 470,327 participants.
Defined-instances run from 0 to 1, labelled using Instancing
2.
Units of measurement are U/L.
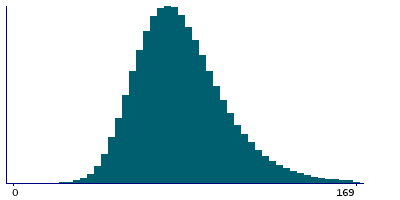
| Maximum | 1416.7 |
| Decile 9 | 113 |
| Decile 8 | 100.3 |
| Decile 7 | 92.2 |
| Decile 6 | 85.9 |
| Median | 80.4 |
| Decile 4 | 75.3 |
| Decile 3 | 70 |
| Decile 2 | 64.3 |
| Decile 1 | 57 |
| Minimum | 8 |
|
|
- Mean = 83.7068
- Std.dev = 26.379
- 3248 items above graph maximum of 169
|
2 Instances
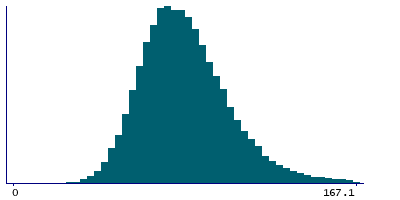
Instance 0 : Initial assessment visit (2006-2010) at which participants were recruited and consent given
469,075 participants, 469,075 items
| Maximum | 1416.7 |
| Decile 9 | 113 |
| Decile 8 | 100.2 |
| Decile 7 | 92.2 |
| Decile 6 | 85.9 |
| Median | 80.4 |
| Decile 4 | 75.2 |
| Decile 3 | 70 |
| Decile 2 | 64.3 |
| Decile 1 | 56.9 |
| Minimum | 8 |
|

|
- Mean = 83.6738
- Std.dev = 26.4629
- 3119 items above graph maximum of 169.1
|
Instance 1 : First repeat assessment visit (2012-13)
17,851 participants, 17,851 items
| Maximum | 488.2 |
| Decile 9 | 112.9 |
| Decile 8 | 100.7 |
| Decile 7 | 93 |
| Decile 6 | 86.9 |
| Median | 81.6 |
| Decile 4 | 76.5 |
| Decile 3 | 71.5 |
| Decile 2 | 65.9 |
| Decile 1 | 58.7 |
| Minimum | 23.5 |
|
|
- Mean = 84.5723
- Std.dev = 24.0545
- 133 items above graph maximum of 167.1
|
Notes
Measured by AMP(IFCC) analysis on a Beckman Coulter AU5800
0 Related Data-Fields
There are no related data-fields
6 Applications
| Application ID | Title |
|---|
| 13721 | Causal associations of circulating biomarkers with cardiovascular disease |
| 50016 | Dummy application for biomarker data |
| 48818 | Evaluate the causal effects of diet-modifiable biomarkers on clinical outcomes using Mendelian randomization |
| 45925 | Risk Factors, Biomarkers and Impact of Major Vision-Threatening Eye Diseases |
| 46466 | Serum cardiometabolic and liver function markers in relation to colorectal cancer risk and survival |
| 5167 | The role of serum-based small molecule antioxidants in preventing and predicting age-related phenotypes and respiratory cancer |

