Data
486,655 items of data are available, covering 470,092 participants.
Defined-instances run from 0 to 1, labelled using Instancing
2.
Units of measurement are umol/L.
| Maximum | 1499.3 |
| Decile 9 | 91.1 |
| Decile 8 | 83.7 |
| Decile 7 | 78.6 |
| Decile 6 | 74.3 |
| Median | 70.5 |
| Decile 4 | 66.9 |
| Decile 3 | 63.3 |
| Decile 2 | 59.5 |
| Decile 1 | 54.9 |
| Minimum | 10.7 |
|

|
- Mean = 72.4093
- Std.dev = 18.5286
- 2575 items above graph maximum of 127.3
|
2 Instances
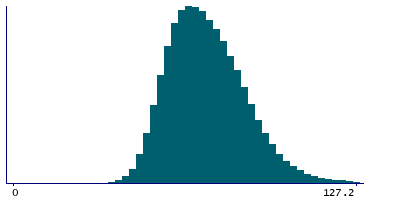
Instance 0 : Initial assessment visit (2006-2010) at which participants were recruited and consent given
468,831 participants, 468,831 items
| Maximum | 1499.3 |
| Decile 9 | 91 |
| Decile 8 | 83.6 |
| Decile 7 | 78.5 |
| Decile 6 | 74.2 |
| Median | 70.4 |
| Decile 4 | 66.8 |
| Decile 3 | 63.2 |
| Decile 2 | 59.4 |
| Decile 1 | 54.8 |
| Minimum | 10.7 |
|
|
- Mean = 72.3091
- Std.dev = 18.5548
- 2472 items above graph maximum of 127.2
|
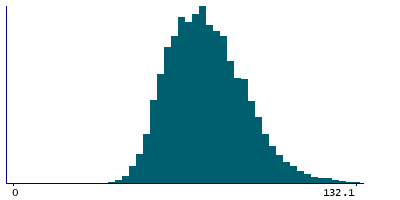
Instance 1 : First repeat assessment visit (2012-13)
17,824 participants, 17,824 items
| Maximum | 873.2 |
| Decile 9 | 94.4 |
| Decile 8 | 87.2 |
| Decile 7 | 81.6 |
| Decile 6 | 77.3 |
| Median | 73.3 |
| Decile 4 | 69.6 |
| Decile 3 | 65.6 |
| Decile 2 | 61.6 |
| Decile 1 | 56.7 |
| Minimum | 34.4 |
|
|
- Mean = 75.0436
- Std.dev = 17.622
- 92 items above graph maximum of 132.1
|
Notes
Measured by enzymatic analysis on a Beckman Coulter AU5800
0 Related Data-Fields
There are no related data-fields
6 Applications
| Application ID | Title |
|---|
| 13721 | Causal associations of circulating biomarkers with cardiovascular disease |
| 50016 | Dummy application for biomarker data |
| 48818 | Evaluate the causal effects of diet-modifiable biomarkers on clinical outcomes using Mendelian randomization |
| 45925 | Risk Factors, Biomarkers and Impact of Major Vision-Threatening Eye Diseases |
| 46466 | Serum cardiometabolic and liver function markers in relation to colorectal cancer risk and survival |
| 5167 | The role of serum-based small molecule antioxidants in preventing and predicting age-related phenotypes and respiratory cancer |

