Data
464,863 items of data are available, covering 449,443 participants.
Defined-instances run from 0 to 1, labelled using Instancing
2.
Units of measurement are nmol/L.
| Maximum | 362 |
| Decile 9 | 76.6 |
| Decile 8 | 66.2 |
| Decile 7 | 58.9 |
| Decile 6 | 52.6 |
| Median | 46.8 |
| Decile 4 | 41 |
| Decile 3 | 35.2 |
| Decile 2 | 29.2 |
| Decile 1 | 22.4 |
| Minimum | 10 |
|

|
- Mean = 48.579
- Std.dev = 21.1409
- 608 items above graph maximum of 130.8
|
2 Instances
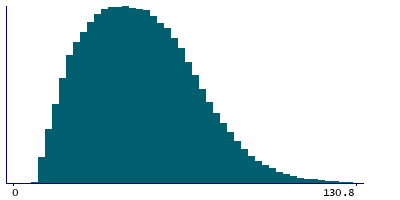
Instance 0 : Initial assessment visit (2006-2010) at which participants were recruited and consent given
447,844 participants, 447,844 items
| Maximum | 340 |
| Decile 9 | 76.6 |
| Decile 8 | 66.2 |
| Decile 7 | 59 |
| Decile 6 | 52.7 |
| Median | 46.8 |
| Decile 4 | 41.1 |
| Decile 3 | 35.3 |
| Decile 2 | 29.3 |
| Decile 1 | 22.4 |
| Minimum | 10 |
|
|
- Mean = 48.6121
- Std.dev = 21.1086
- 574 items above graph maximum of 130.8
|
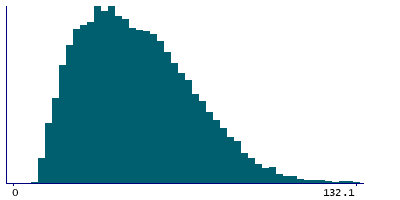
Instance 1 : First repeat assessment visit (2012-13)
17,019 participants, 17,019 items
| Maximum | 362 |
| Decile 9 | 76.9 |
| Decile 8 | 65.8 |
| Decile 7 | 57.8 |
| Decile 6 | 51.3 |
| Median | 45 |
| Decile 4 | 39.1 |
| Decile 3 | 33.6 |
| Decile 2 | 27.9 |
| Decile 1 | 21.65 |
| Minimum | 10 |
|
|
- Mean = 47.7065
- Std.dev = 21.9558
- 32 items above graph maximum of 132.15
|
Notes
Measured by CLIA analysis on a DiaSorin Ltd. LIASON XL
0 Related Data-Fields
There are no related data-fields
6 Applications
| Application ID | Title |
|---|
| 13721 | Causal associations of circulating biomarkers with cardiovascular disease |
| 50016 | Dummy application for biomarker data |
| 48818 | Evaluate the causal effects of diet-modifiable biomarkers on clinical outcomes using Mendelian randomization |
| 45925 | Risk Factors, Biomarkers and Impact of Major Vision-Threatening Eye Diseases |
| 46466 | Serum cardiometabolic and liver function markers in relation to colorectal cancer risk and survival |
| 5167 | The role of serum-based small molecule antioxidants in preventing and predicting age-related phenotypes and respiratory cancer |

