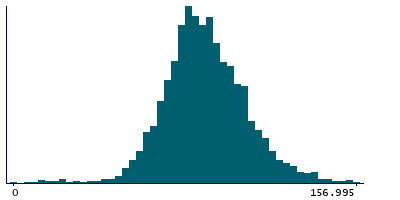
Data
2,535 items of data are available, covering 1,273 participants.
Defined-instances run from 2 to 3, labelled using Instancing
2.
Units of measurement are pg/ml.
| Maximum | 235.26 |
| Decile 9 | 111.68 |
| Decile 8 | 102.57 |
| Decile 7 | 96.215 |
| Decile 6 | 90.92 |
| Median | 86.765 |
| Decile 4 | 82.24 |
| Decile 3 | 78.275 |
| Decile 2 | 73.55 |
| Decile 1 | 66.365 |
| Minimum | 1.47 |
|
|
- Mean = 87.8947
- Std.dev = 19.3692
- 6 items above graph maximum of 156.995
|
2 Instances
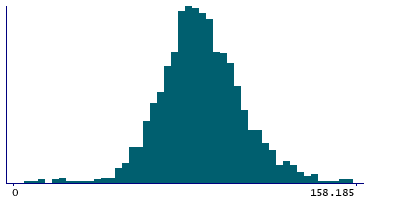
Instance 2 : Imaging visit (2014+)
1,268 participants, 1,268 items
| Maximum | 201.06 |
| Decile 9 | 111.085 |
| Decile 8 | 101.48 |
| Decile 7 | 95.43 |
| Decile 6 | 90.075 |
| Median | 85.81 |
| Decile 4 | 81.745 |
| Decile 3 | 77.235 |
| Decile 2 | 71.705 |
| Decile 1 | 63.985 |
| Minimum | 7.2 |
|
|
- Mean = 86.714
- Std.dev = 19.6869
- 2 items above graph maximum of 158.185
|
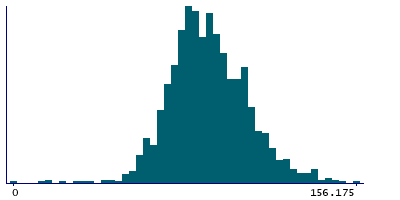
Instance 3 : First repeat imaging visit (2019+)
1,267 participants, 1,267 items
| Maximum | 235.26 |
| Decile 9 | 112.3 |
| Decile 8 | 104.135 |
| Decile 7 | 97.18 |
| Decile 6 | 92.23 |
| Median | 87.81 |
| Decile 4 | 83.095 |
| Decile 3 | 79.34 |
| Decile 2 | 74.64 |
| Decile 1 | 68.425 |
| Minimum | 1.47 |
|
|
- Mean = 89.0763
- Std.dev = 18.9725
- 4 items above graph maximum of 156.175
|
Notes
Amyloid beta-40, Amyloid beta-42, Glial fibrillary acidic protein and NeuroFilament Light were assayed on a Quanterix Simoa HD-X Analyser employing a 4plex E assay.
These data were derived in association with project 76059.
0 Related Data-Fields
There are no related data-fields

