Data
2,531 items of data are available, covering 1,273 participants.
Defined-instances run from 2 to 3, labelled using Instancing
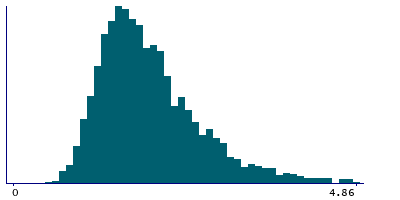
2.
Units of measurement are pg/ml.
| Maximum | 208.74 |
| Decile 9 | 3.015 |
| Decile 8 | 2.52 |
| Decile 7 | 2.2 |
| Decile 6 | 2 |
| Median | 1.81 |
| Decile 4 | 1.66 |
| Decile 3 | 1.51 |
| Decile 2 | 1.36 |
| Decile 1 | 1.17 |
| Minimum | 0.51 |
|
|
- Mean = 2.16301
- Std.dev = 4.34481
- 58 items above graph maximum of 4.86
|
2 Instances
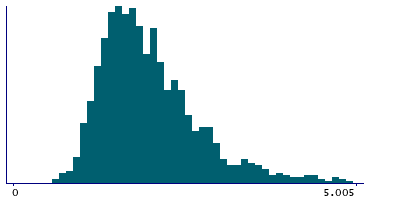
Instance 2 : Imaging visit (2014+)
1,265 participants, 1,265 items
| Maximum | 37.12 |
| Decile 9 | 3.12 |
| Decile 8 | 2.56 |
| Decile 7 | 2.28 |
| Decile 6 | 2.05 |
| Median | 1.865 |
| Decile 4 | 1.72 |
| Decile 3 | 1.56 |
| Decile 2 | 1.42 |
| Decile 1 | 1.235 |
| Minimum | 0.64 |
|
|
- Mean = 2.18619
- Std.dev = 1.69667
- 35 items above graph maximum of 5.005
|
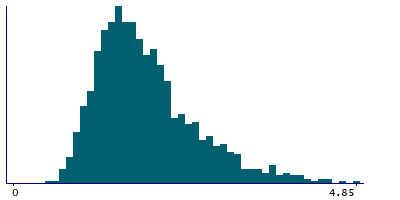
Instance 3 : First repeat imaging visit (2019+)
1,266 participants, 1,266 items
| Maximum | 208.74 |
| Decile 9 | 2.99 |
| Decile 8 | 2.46 |
| Decile 7 | 2.135 |
| Decile 6 | 1.94 |
| Median | 1.76 |
| Decile 4 | 1.595 |
| Decile 3 | 1.46 |
| Decile 2 | 1.3 |
| Decile 1 | 1.13 |
| Minimum | 0.51 |
|
|
- Mean = 2.13984
- Std.dev = 5.90443
- 22 items above graph maximum of 4.85
|
Notes
pTau-181 was assayed on a Quanterix Simoa HD-X Analyser.
These data were derived in association with project 76059.
0 Related Data-Fields
There are no related data-fields

