Data
3,774,105 items of data are available, covering 499,416 participants.
Some values have special meanings defined by Data-Coding
439.
Defined-instances run from 0 to 3, labelled using Instancing
2.
Array indices run from 0 to 6.
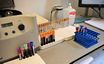
| Maximum | 2025-08-30 |
| Decile 9 | 2015-06-01 |
| Decile 8 | 2010-05-24 |
| Decile 7 | 2010-01-25 |
| Decile 6 | 2009-09-13 |
| Median | 2009-05-12 |
| Decile 4 | 2009-01-14 |
| Decile 3 | 2008-09-11 |
| Decile 2 | 2008-05-17 |
| Decile 1 | 2008-01-24 |
| Minimum | 2006-03-13 |
|
|
- Mean = 2010-07-16
- 170201 items above graph maximum of 2022-10-07
- 163934 items have value 1900-01-01 (Not performed)
|
4 Instances
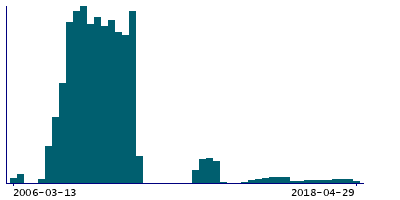
Instance 0 : Initial assessment visit (2006-2010) at which participants were recruited and consent given
499,143 participants, 3,080,507 items
| Maximum | 2010-10-01 |
| Decile 9 | 2010-04-23 |
| Decile 8 | 2009-12-15 |
| Decile 7 | 2009-09-09 |
| Decile 6 | 2009-05-28 |
| Median | 2009-02-15 |
| Decile 4 | 2008-10-27 |
| Decile 3 | 2008-07-24 |
| Decile 2 | 2008-04-16 |
| Decile 1 | 2007-12-20 |
| Minimum | 2006-03-13 |
|
|
- Mean = 2009-02-08
- 34523 items have value 1900-01-01 (Not performed)
|
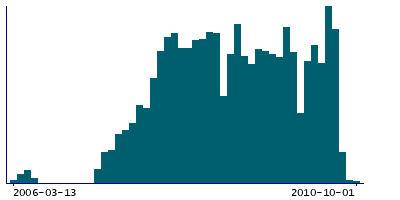
Instance 1 : First repeat assessment visit (2012-13)
20,252 participants, 140,967 items
| Maximum | 2013-06-08 |
| Decile 9 | 2013-05-15 |
| Decile 8 | 2013-04-22 |
| Decile 7 | 2013-03-24 |
| Decile 6 | 2013-02-25 |
| Median | 2013-01-28 |
| Decile 4 | 2012-12-15 |
| Decile 3 | 2012-11-16 |
| Decile 2 | 2012-10-18 |
| Decile 1 | 2012-09-18 |
| Minimum | 2012-08-01 |
|
|
- Mean = 2013-01-19
- 797 items have value 1900-01-01 (Not performed)
|
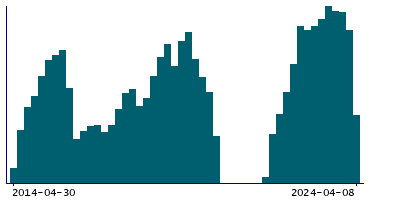
Instance 2 : Imaging visit (2014+)
99,882 participants, 326,570 items
| Maximum | 2025-08-30 |
| Decile 9 | 2024-09-13 |
| Decile 8 | 2023-12-02 |
| Decile 7 | 2023-04-27 |
| Decile 6 | 2022-08-25 |
| Median | 2019-12-18 |
| Decile 4 | 2019-02-23 |
| Decile 3 | 2018-04-18 |
| Decile 2 | 2016-11-27 |
| Decile 1 | 2015-07-15 |
| Minimum | 2014-04-30 |
|
|
- Mean = 2020-07-01
- 107941 items have value 1900-01-01 (Not performed)
|
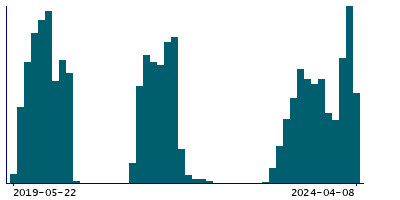
Instance 3 : First repeat imaging visit (2019+)
20,700 participants, 62,127 items
| Maximum | 2025-08-30 |
| Decile 9 | 2025-05-28 |
| Decile 8 | 2025-03-03 |
| Decile 7 | 2024-11-25 |
| Decile 6 | 2024-09-03 |
| Median | 2024-06-10 |
| Decile 4 | 2024-02-19 |
| Decile 3 | 2023-06-10 |
| Decile 2 | 2021-05-28 |
| Decile 1 | 2019-12-07 |
| Minimum | 2019-05-22 |
|
|
- Mean = 2023-08-02
- 20673 items have value 1900-01-01 (Not performed)
|
Notes
This is the time when each blood sample was recorded on the computerised system by swiping the unique barcode on the collection tube. Generally it is a few seconds after the sample is actually extracted.
In about 36,000 cases a clock error on the collection system resulted in incorrect extraction times being saved. These values have been removed from the database.