Data
68,033 items of data are available, covering 64,317 participants.
Defined-instances run from 2 to 3, labelled using Instancing
2.
Units of measurement are %.
| Maximum | 1743.34 |
| Decile 9 | 261.769 |
| Decile 8 | 230.767 |
| Decile 7 | 210.375 |
| Decile 6 | 193.826 |
| Median | 179.043 |
| Decile 4 | 164.601 |
| Decile 3 | 150.291 |
| Decile 2 | 133.414 |
| Decile 1 | 109.954 |
| Minimum | -70.4319 |
|

|
- Mean = 182.822
- Std.dev = 62.9427
- 8 items below graph minimum of -41.8605
- 134 items above graph maximum of 413.584
|
2 Instances
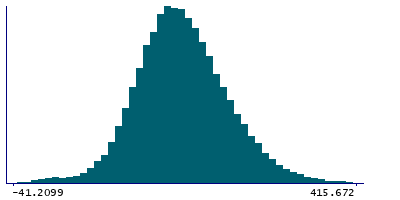
Instance 2 : Imaging visit (2014+)
63,839 participants, 63,839 items
| Maximum | 1743.34 |
| Decile 9 | 262.699 |
| Decile 8 | 231.71 |
| Decile 7 | 211.12 |
| Decile 6 | 194.498 |
| Median | 179.672 |
| Decile 4 | 165.177 |
| Decile 3 | 150.804 |
| Decile 2 | 133.715 |
| Decile 1 | 110.227 |
| Minimum | -70.4319 |
|
|
- Mean = 183.426
- Std.dev = 63.2228
- 7 items below graph minimum of -42.2452
- 125 items above graph maximum of 415.171
|
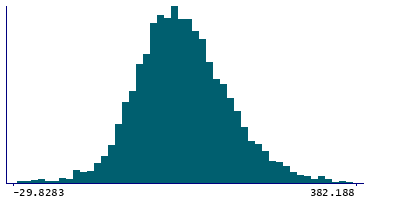
Instance 3 : First repeat imaging visit (2019+)
4,194 participants, 4,194 items
| Maximum | 827.339 |
| Decile 9 | 244.67 |
| Decile 8 | 218.171 |
| Decile 7 | 198.922 |
| Decile 6 | 183.498 |
| Median | 169.671 |
| Decile 4 | 156.965 |
| Decile 3 | 143.231 |
| Decile 2 | 128.267 |
| Decile 1 | 107.511 |
| Minimum | -38.2272 |
|
|
- Mean = 173.625
- Std.dev = 57.7383
- 1 item below graph minimum of -29.6492
- 10 items above graph maximum of 381.83
|
Notes
90th percentile of the BOLD effect (in group-defined mask) for shapes activation (in task fMRI data, using cortical surface analysis)
1 Related Data-Field
| Field ID | Description | Relationship |
|---|
| 25761 | 90th percentile of BOLD effect (in g ... | Field 25761 is an analogue for Current Field |