Data
68,033 items of data are available, covering 64,317 participants.
Defined-instances run from 2 to 3, labelled using Instancing
2.
Units of measurement are %.
| Maximum | 259.385 |
| Decile 9 | 27.5821 |
| Decile 8 | 22.7319 |
| Decile 7 | 19.4594 |
| Decile 6 | 16.8231 |
| Median | 14.4203 |
| Decile 4 | 12.065 |
| Decile 3 | 9.55218 |
| Decile 2 | 6.36954 |
| Decile 1 | 1.33076 |
| Minimum | -277.139 |
|

|
- Mean = 14.3437
- Std.dev = 12.0999
- 379 items below graph minimum of -24.9205
- 190 items above graph maximum of 53.8334
|
2 Instances
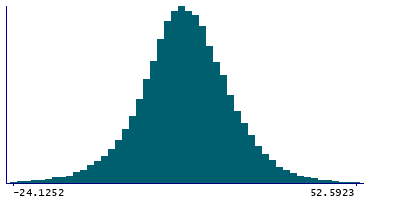
Instance 2 : Imaging visit (2014+)
63,839 participants, 63,839 items
| Maximum | 259.385 |
| Decile 9 | 27.597 |
| Decile 8 | 22.7204 |
| Decile 7 | 19.4245 |
| Decile 6 | 16.7845 |
| Median | 14.3574 |
| Decile 4 | 11.9964 |
| Decile 3 | 9.46849 |
| Decile 2 | 6.27856 |
| Decile 1 | 1.20928 |
| Minimum | -277.139 |
|
|
- Mean = 14.2788
- Std.dev = 12.1894
- 361 items below graph minimum of -25.1785
- 173 items above graph maximum of 53.9848
|
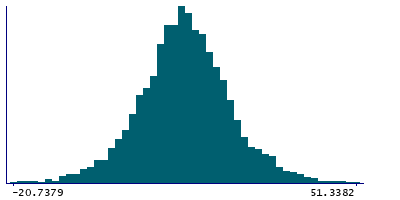
Instance 3 : First repeat imaging visit (2019+)
4,194 participants, 4,194 items
| Maximum | 136.969 |
| Decile 9 | 27.3129 |
| Decile 8 | 22.795 |
| Decile 7 | 19.7738 |
| Decile 6 | 17.37 |
| Median | 15.2016 |
| Decile 4 | 13.1155 |
| Decile 3 | 10.751 |
| Decile 2 | 7.83678 |
| Decile 1 | 3.28747 |
| Minimum | -55.3617 |
|
|
- Mean = 15.3317
- Std.dev = 10.5975
- 14 items below graph minimum of -20.7379
- 18 items above graph maximum of 51.3382
|
Notes
Median BOLD effect (in group-defined amygdala activation mask) for faces-shapes contrast (in task fMRI data, using cortical surface analysis)
1 Related Data-Field
| Field ID | Description | Relationship |
|---|
| 25052 | Median BOLD effect (in group-defined ... | Field 25052 is an analogue for Current Field |