Data
4,528,491 items of data are available, covering 240,060 participants.
Defined-instances run from 0 to 3, labelled using Instancing
2.
Array indices run from 1 to 15.
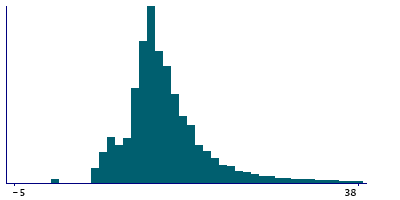
Units of measurement are deciseconds.
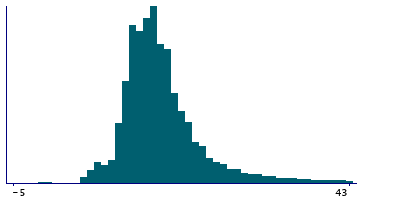
| Maximum | 33045 |
| Decile 9 | 27 |
| Decile 8 | 20 |
| Decile 7 | 18 |
| Decile 6 | 16 |
| Median | 15 |
| Decile 4 | 14 |
| Decile 3 | 13 |
| Decile 2 | 12 |
| Decile 1 | 11 |
| Minimum | -5 |
|
|
- There are 2055 distinct values.
- Mean = 23.4257
- Std.dev = 64.7532
- 213659 items above graph maximum of 43
|
4 Instances
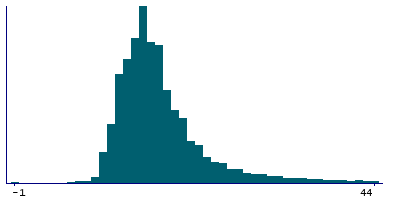
Instance 0 : Initial assessment visit (2006-2010) at which participants were recruited and consent given
165,998 participants, 2,457,471 items
| Maximum | 25687 |
| Decile 9 | 28 |
| Decile 8 | 21 |
| Decile 7 | 19 |
| Decile 6 | 17 |
| Median | 16 |
| Decile 4 | 15 |
| Decile 3 | 14 |
| Decile 2 | 13 |
| Decile 1 | 12 |
| Minimum | -1 |
|
|
- There are 1936 distinct values.
- Mean = 25.9475
- Std.dev = 70.0641
- 126476 items above graph maximum of 44
|
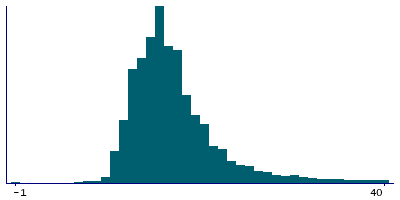
Instance 1 : First repeat assessment visit (2012-13)
19,952 participants, 297,950 items
| Maximum | 3924 |
| Decile 9 | 26 |
| Decile 8 | 20 |
| Decile 7 | 18 |
| Decile 6 | 17 |
| Median | 16 |
| Decile 4 | 15 |
| Decile 3 | 14 |
| Decile 2 | 13 |
| Decile 1 | 12 |
| Minimum | -1 |
|
|
- There are 971 distinct values.
- Mean = 23.618
- Std.dev = 54.3045
- 14577 items above graph maximum of 40
|
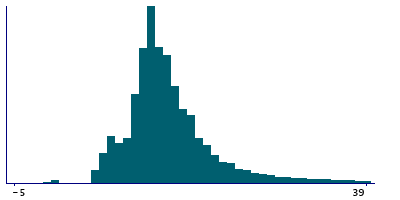
Instance 2 : Imaging visit (2014+)
98,265 participants, 1,466,211 items
| Maximum | 33045 |
| Decile 9 | 24 |
| Decile 8 | 18 |
| Decile 7 | 16 |
| Decile 6 | 14 |
| Median | 13 |
| Decile 4 | 12 |
| Decile 3 | 11 |
| Decile 2 | 10 |
| Decile 1 | 8 |
| Minimum | -5 |
|
|
- There are 1334 distinct values.
- Mean = 20.1181
- Std.dev = 60.7088
- 64891 items above graph maximum of 40
|
Instance 3 : First repeat imaging visit (2019+)
20,574 participants, 306,859 items
| Maximum | 4154 |
| Decile 9 | 23 |
| Decile 8 | 17 |
| Decile 7 | 15 |
| Decile 6 | 14 |
| Median | 13 |
| Decile 4 | 12 |
| Decile 3 | 11 |
| Decile 2 | 10 |
| Decile 1 | 8 |
| Minimum | -5 |
|
|
- There are 822 distinct values.
- Mean = 18.847
- Std.dev = 44.3521
- 13090 items above graph maximum of 38
|


