Data
306,365 items of data are available, covering 243,183 participants.
Defined-instances run from 0 to 3, labelled using Instancing
2.
Units of measurement are seconds.
| Maximum | 63143 |
| Decile 9 | 1721 |
| Decile 8 | 1496 |
| Decile 7 | 1261 |
| Decile 6 | 632 |
| Median | 522 |
| Decile 4 | 436 |
| Decile 3 | 401 |
| Decile 2 | 377 |
| Decile 1 | 352 |
| Minimum | 62 |
|
|
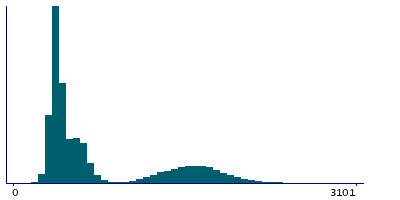
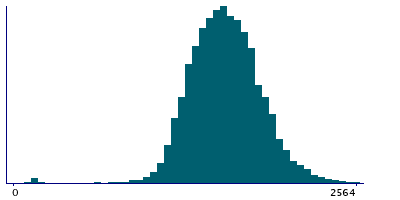
- There are 2882 distinct values.
- Mean = 836.942
- Std.dev = 626.254
- 216 items above graph maximum of 3090
|
4 Instances
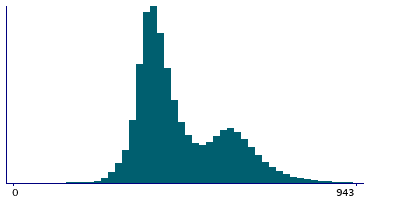
Instance 0 : Initial assessment visit (2006-2010) at which participants were recruited and consent given
171,365 participants, 171,365 items
| Maximum | 62462 |
| Decile 9 | 642 |
| Decile 8 | 582 |
| Decile 7 | 513 |
| Decile 6 | 451 |
| Median | 419 |
| Decile 4 | 398 |
| Decile 3 | 380 |
| Decile 2 | 363 |
| Decile 1 | 341 |
| Minimum | 62 |
|
|
- There are 1075 distinct values.
- Mean = 462.401
- Std.dev = 196.731
- 428 items above graph maximum of 943
|
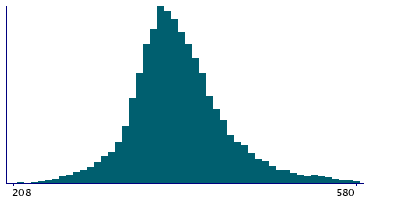
Instance 1 : First repeat assessment visit (2012-13)
20,309 participants, 20,309 items
| Maximum | 1508 |
| Decile 9 | 456 |
| Decile 8 | 424 |
| Decile 7 | 407 |
| Decile 6 | 394 |
| Median | 383 |
| Decile 4 | 372 |
| Decile 3 | 362 |
| Decile 2 | 350 |
| Decile 1 | 332 |
| Minimum | 126 |
|
|
- There are 487 distinct values.
- Mean = 389.639
- Std.dev = 58.5491
- 17 items below graph minimum of 208
- 192 items above graph maximum of 580
|
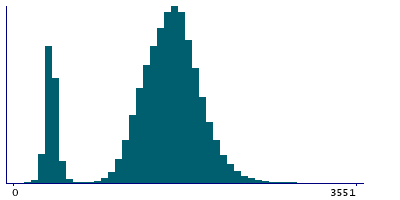
Instance 2 : Imaging visit (2014+)
94,752 participants, 94,752 items
| Maximum | 63143 |
| Decile 9 | 1951 |
| Decile 8 | 1805 |
| Decile 7 | 1708 |
| Decile 6 | 1621 |
| Median | 1535 |
| Decile 4 | 1449 |
| Decile 3 | 1358 |
| Decile 2 | 1243 |
| Decile 1 | 434 |
| Minimum | 94 |
|
|
- There are 2606 distinct values.
- Mean = 1468
- Std.dev = 618.35
- 168 items above graph maximum of 3468
|
Instance 3 : First repeat imaging visit (2019+)
19,939 participants, 19,939 items
| Maximum | 13929 |
| Decile 9 | 1824 |
| Decile 8 | 1699 |
| Decile 7 | 1610 |
| Decile 6 | 1541 |
| Median | 1481 |
| Decile 4 | 1424 |
| Decile 3 | 1369 |
| Decile 2 | 1308 |
| Decile 1 | 1229 |
| Minimum | 124 |
|
|
- There are 1464 distinct values.
- Mean = 1512.66
- Std.dev = 338.372
- 40 items below graph minimum of 634
- 71 items above graph maximum of 2419
|
Notes
This is the time between completing the initial prompt and displaying answer. Between the initial prompt and the final challenge, various other tests were done so the time here depends strongly on how long the participants took to do these intervening tests and the number/complexity of them. The number of intervening tests has varied throughout the study, generally being larger at the imaging centres than in the original assessment centres, and hence there is systematic bias across time.
0 Related Data-Fields
There are no related data-fields


