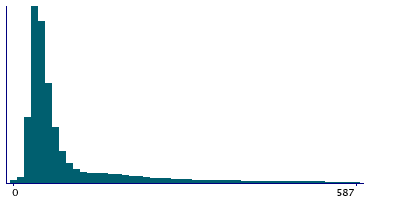
Data
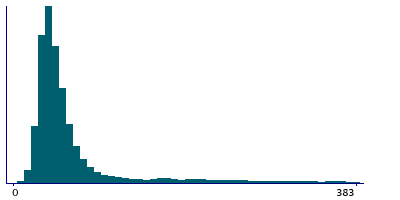
306,365 items of data are available, covering 243,183 participants.
Defined-instances run from 0 to 3, labelled using Instancing
2.
Units of measurement are deciseconds.
| Maximum | 89639 |
| Decile 9 | 304 |
| Decile 8 | 145 |
| Decile 7 | 80 |
| Decile 6 | 62 |
| Median | 53 |
| Decile 4 | 46 |
| Decile 3 | 41 |
| Decile 2 | 36 |
| Decile 1 | 31 |
| Minimum | 0 |
|
|
- There are 2233 distinct values.
- Mean = 128.001
- Std.dev = 281.636
- 12578 items above graph maximum of 577
|
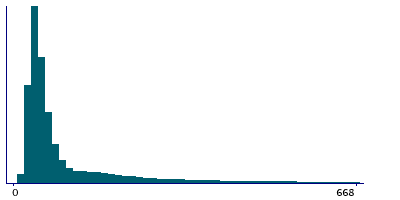
4 Instances
Instance 0 : Initial assessment visit (2006-2010) at which participants were recruited and consent given
171,365 participants, 171,365 items
| Maximum | 89639 |
| Decile 9 | 350 |
| Decile 8 | 172 |
| Decile 7 | 93 |
| Decile 6 | 68 |
| Median | 57 |
| Decile 4 | 49 |
| Decile 3 | 43 |
| Decile 2 | 38 |
| Decile 1 | 32 |
| Minimum | 0 |
|
|
- There are 2161 distinct values.
- Mean = 146.021
- Std.dev = 343.168
- 7132 items above graph maximum of 668
|
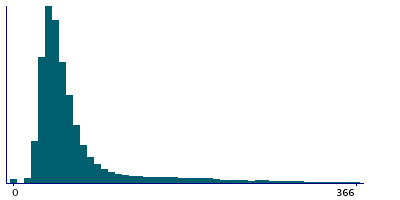
Instance 1 : First repeat assessment visit (2012-13)
20,309 participants, 20,309 items
| Maximum | 5442 |
| Decile 9 | 199 |
| Decile 8 | 91 |
| Decile 7 | 67 |
| Decile 6 | 57 |
| Median | 50 |
| Decile 4 | 44 |
| Decile 3 | 40 |
| Decile 2 | 35 |
| Decile 1 | 30 |
| Minimum | 0 |
|
|
- There are 927 distinct values.
- Mean = 100.594
- Std.dev = 181.896
- 1025 items above graph maximum of 368
|
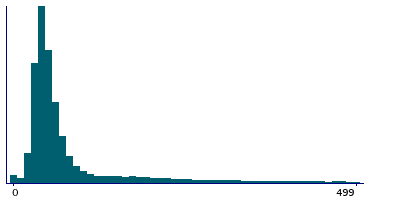
Instance 2 : Imaging visit (2014+)
94,752 participants, 94,752 items
| Maximum | 6657 |
| Decile 9 | 265.5 |
| Decile 8 | 115 |
| Decile 7 | 70 |
| Decile 6 | 57 |
| Median | 50 |
| Decile 4 | 44 |
| Decile 3 | 40 |
| Decile 2 | 35 |
| Decile 1 | 30 |
| Minimum | 0 |
|
|
- There are 1385 distinct values.
- Mean = 108.65
- Std.dev = 173.086
- 3570 items above graph maximum of 501
|
Instance 3 : First repeat imaging visit (2019+)
19,939 participants, 19,939 items
| Maximum | 6215 |
| Decile 9 | 219 |
| Decile 8 | 83 |
| Decile 7 | 60 |
| Decile 6 | 51 |
| Median | 45 |
| Decile 4 | 40 |
| Decile 3 | 36 |
| Decile 2 | 32 |
| Decile 1 | 28 |
| Minimum | 8 |
|
|
- There are 836 distinct values.
- Mean = 93.0063
- Std.dev = 154.895
- 828 items above graph maximum of 410
|


