Data
9,226 items of data are available, covering 4,613 participants.
Defined-instances run from 2 to 3, labelled using Instancing
2.
Units of measurement are AU.
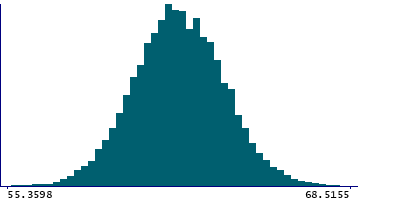
| Maximum | 72.7836 |
| Decile 9 | 64.1303 |
| Decile 8 | 63.3928 |
| Decile 7 | 62.8445 |
| Decile 6 | 62.3797 |
| Median | 61.9192 |
| Decile 4 | 61.4861 |
| Decile 3 | 61.025 |
| Decile 2 | 60.4883 |
| Decile 1 | 59.745 |
| Minimum | 50.5215 |
|
|
- Mean = 61.9387
- Std.dev = 1.76167
- 3 items below graph minimum of 55.3598
- 8 items above graph maximum of 68.5155
|
2 Instances
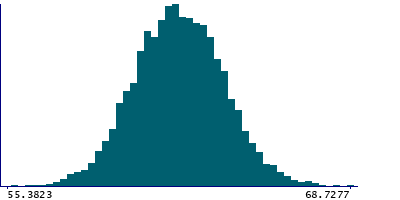
Instance 2 : Imaging visit (2014+)
4,613 participants, 4,613 items
| Maximum | 72.7836 |
| Decile 9 | 64.2792 |
| Decile 8 | 63.5014 |
| Decile 7 | 62.9852 |
| Decile 6 | 62.5081 |
| Median | 62.0342 |
| Decile 4 | 61.5861 |
| Decile 3 | 61.0953 |
| Decile 2 | 60.586 |
| Decile 1 | 59.8308 |
| Minimum | 50.5215 |
|
|
- Mean = 62.0473
- Std.dev = 1.76256
- 1 item below graph minimum of 55.3823
- 3 items above graph maximum of 68.7277
|
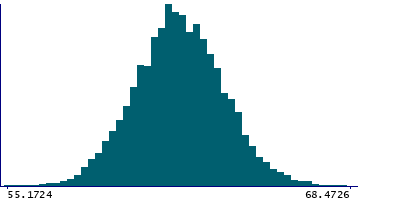
Instance 3 : First repeat imaging visit (2019+)
4,613 participants, 4,613 items
| Maximum | 69.8553 |
| Decile 9 | 64.0392 |
| Decile 8 | 63.2622 |
| Decile 7 | 62.7223 |
| Decile 6 | 62.2477 |
| Median | 61.8063 |
| Decile 4 | 61.3922 |
| Decile 3 | 60.9382 |
| Decile 2 | 60.3805 |
| Decile 1 | 59.6058 |
| Minimum | 52.1359 |
|
|
- Mean = 61.8302
- Std.dev = 1.75406
- 1 item below graph minimum of 55.1724
- 4 items above graph maximum of 68.4726
|
Notes
Mean intensity of the cerebellum cortex in the right hemisphere generated by subcortical volumetric segmentation (aseg) with the longitudinal processing option in FreeSurfer.
1 Related Data-Field
| Field ID | Description | Relationship |
|---|
| 42951 | Mean intensity of Cerebellum-Cortex ... | Field 42951 is the left-side counterpart of right-side Current Field |
0 Resources
There are no matching Resources
