Data
298,704 items of data are available, covering 236,512 participants.
Defined-instances run from 0 to 3, labelled using Instancing
2.
| Maximum | 48307 |
| Decile 9 | 215 |
| Decile 8 | 150 |
| Decile 7 | 124 |
| Decile 6 | 108 |
| Median | 97 |
| Decile 4 | 88 |
| Decile 3 | 80 |
| Decile 2 | 72 |
| Decile 1 | 63 |
| Minimum | 12 |
|
|
- There are 1615 distinct values.
- Mean = 131.992
- Std.dev = 160.73
- 11754 items above graph maximum of 367
|
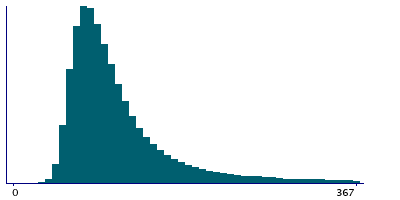
4 Instances
Instance 0 : Initial assessment visit (2006-2010) at which participants were recruited and consent given
165,284 participants, 165,284 items
| Maximum | 4419 |
| Decile 9 | 221 |
| Decile 8 | 154 |
| Decile 7 | 127 |
| Decile 6 | 110 |
| Median | 98 |
| Decile 4 | 89 |
| Decile 3 | 80 |
| Decile 2 | 72 |
| Decile 1 | 63 |
| Minimum | 12 |
|
|
- There are 1424 distinct values.
- Mean = 133.926
- Std.dev = 132.619
- 6319 items above graph maximum of 379
|
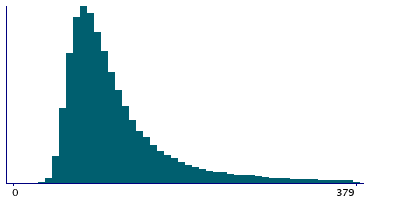
Instance 1 : First repeat assessment visit (2012-13)
20,091 participants, 20,091 items
| Maximum | 3505 |
| Decile 9 | 196 |
| Decile 8 | 140 |
| Decile 7 | 117 |
| Decile 6 | 104 |
| Median | 93 |
| Decile 4 | 85 |
| Decile 3 | 78 |
| Decile 2 | 70 |
| Decile 1 | 62 |
| Minimum | 28 |
|
|
- There are 728 distinct values.
- Mean = 124.116
- Std.dev = 117.928
- 803 items above graph maximum of 330
|
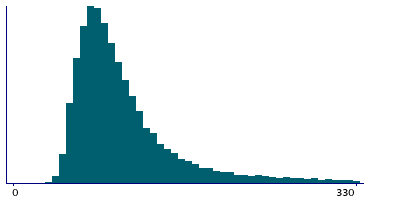
Instance 2 : Imaging visit (2014+)
93,584 participants, 93,584 items
| Maximum | 48307 |
| Decile 9 | 211 |
| Decile 8 | 146 |
| Decile 7 | 121 |
| Decile 6 | 107 |
| Median | 96 |
| Decile 4 | 88 |
| Decile 3 | 80 |
| Decile 2 | 73 |
| Decile 1 | 64 |
| Minimum | 26 |
|
|
- There are 1215 distinct values.
- Mean = 131.48
- Std.dev = 212.667
- 3884 items above graph maximum of 358
|
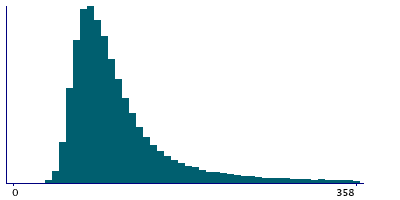
Instance 3 : First repeat imaging visit (2019+)
19,745 participants, 19,745 items
| Maximum | 3467 |
| Decile 9 | 199 |
| Decile 8 | 142 |
| Decile 7 | 119 |
| Decile 6 | 105 |
| Median | 94 |
| Decile 4 | 86 |
| Decile 3 | 79 |
| Decile 2 | 72 |
| Decile 1 | 64 |
| Minimum | 29 |
|

|
- There are 726 distinct values.
- Mean = 126.24
- Std.dev = 122.277
- 815 items above graph maximum of 334
|

