Data
2,525,873 items of data are available, covering 88,312 participants.
Defined-instances run from 2 to 3, labelled using Instancing
2.
Array indices run from 0 to 29.
Units of measurement are milliseconds.
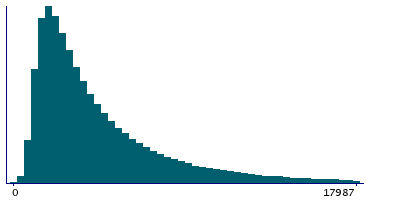
| Maximum | 26692 |
| Decile 9 | 9640 |
| Decile 8 | 6724 |
| Decile 7 | 5172 |
| Decile 6 | 4134 |
| Median | 3375 |
| Decile 4 | 2777 |
| Decile 3 | 2281 |
| Decile 2 | 1841 |
| Decile 1 | 1406 |
| Minimum | 0 |
|
|
- There are 6132 distinct values.
- Mean = 4660.92
- Std.dev = 3906.46
- 42464 items above graph maximum of 17874
|
2 Instances
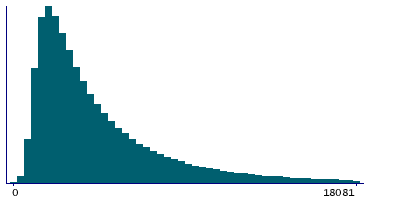
Instance 2 : Imaging visit (2014+)
81,801 participants, 2,033,797 items
| Maximum | 26625 |
| Decile 9 | 9688 |
| Decile 8 | 6754 |
| Decile 7 | 5187 |
| Decile 6 | 4141 |
| Median | 3375 |
| Decile 4 | 2777 |
| Decile 3 | 2278 |
| Decile 2 | 1841 |
| Decile 1 | 1404 |
| Minimum | 0 |
|
|
- There are 6122 distinct values.
- Mean = 4674.18
- Std.dev = 3931.73
- 34164 items above graph maximum of 17972
|
Instance 3 : First repeat imaging visit (2019+)
19,822 participants, 492,076 items
| Maximum | 26692 |
| Decile 9 | 9407 |
| Decile 8 | 6630 |
| Decile 7 | 5125 |
| Decile 6 | 4110 |
| Median | 3360 |
| Decile 4 | 2781 |
| Decile 3 | 2294 |
| Decile 2 | 1859 |
| Decile 1 | 1437 |
| Minimum | 0 |
|

|
- There are 5609 distinct values.
- Mean = 4606.14
- Std.dev = 3799.76
- 8280 items above graph maximum of 17377
|


