Data
1,683,143 items of data are available, covering 49,721 participants.
Defined-instances run from 2 to 3, labelled using Instancing
2.
Array indices run from 0 to 44.
Units of measurement are msec.
| Maximum | 1.64375e+06 |
| Decile 9 | 5812 |
| Decile 8 | 3375 |
| Decile 7 | 2578 |
| Decile 6 | 2188 |
| Median | 1938 |
| Decile 4 | 1765 |
| Decile 3 | 1609 |
| Decile 2 | 1468 |
| Decile 1 | 1313 |
| Minimum | 0 |
|
|
- There are 6651 distinct values.
- Mean = 3049.31
- Std.dev = 3897.44
- 67397 items above graph maximum of 10311
|
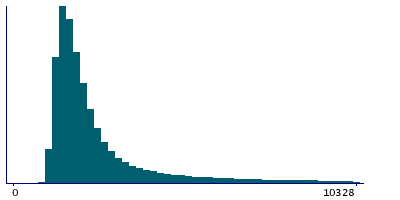
2 Instances
Instance 2 : Imaging visit (2014+)
35,669 participants, 1,188,005 items
| Maximum | 1.64375e+06 |
| Decile 9 | 5828 |
| Decile 8 | 3375 |
| Decile 7 | 2563 |
| Decile 6 | 2187 |
| Median | 1938 |
| Decile 4 | 1750 |
| Decile 3 | 1594 |
| Decile 2 | 1454 |
| Decile 1 | 1313 |
| Minimum | 0 |
|

|
- There are 6093 distinct values.
- Mean = 3052.78
- Std.dev = 4073.75
- 47487 items above graph maximum of 10343
|
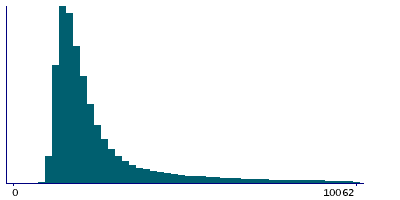
Instance 3 : First repeat imaging visit (2019+)
14,848 participants, 495,138 items
| Maximum | 153281 |
| Decile 9 | 5766 |
| Decile 8 | 3375 |
| Decile 7 | 2578 |
| Decile 6 | 2203 |
| Median | 1953 |
| Decile 4 | 1766 |
| Decile 3 | 1610 |
| Decile 2 | 1469 |
| Decile 1 | 1328 |
| Minimum | 172 |
|
|
- There are 4777 distinct values.
- Mean = 3041
- Std.dev = 3437.72
- 19964 items above graph maximum of 10204
|
Notes
This is the time interval between presenting an image and participant making an initial selection. If the participant changed their mind about their selection then the time for that change is not recorded.
0 Related Data-Fields
There are no related data-fields