Data
388,542 items of data are available, covering 312,663 participants.
Some values have special meanings defined by Data-Coding
100291.
Defined-instances run from 0 to 3, labelled using Instancing
2.
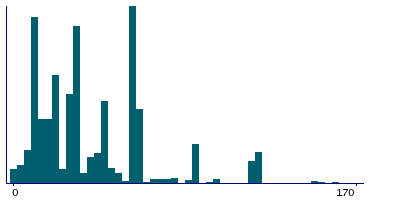
Units of measurement are minutes/day.
| Maximum | 1440 |
| Decile 9 | 90 |
| Decile 8 | 60 |
| Decile 7 | 60 |
| Decile 6 | 40 |
| Median | 30 |
| Decile 4 | 30 |
| Decile 3 | 20 |
| Decile 2 | 15 |
| Decile 1 | 10 |
| Minimum | 0 |
|
|
- There are 204 distinct values.
- Mean = 44.4044
- Std.dev = 46.5435
- 9851 items above graph maximum of 170
- 1012 items have value -3 (Prefer not to answer)
- 29474 items have value -1 (Do not know)
|
4 Instances
Instance 0 : Initial assessment visit (2006-2010) at which participants were recruited and consent given
294,389 participants, 294,389 items
| Maximum | 1440 |
| Decile 9 | 90 |
| Decile 8 | 60 |
| Decile 7 | 60 |
| Decile 6 | 40 |
| Median | 30 |
| Decile 4 | 30 |
| Decile 3 | 20 |
| Decile 2 | 15 |
| Decile 1 | 10 |
| Minimum | 0 |
|

|
- There are 193 distinct values.
- Mean = 44.8604
- Std.dev = 48.1738
- 7814 items above graph maximum of 170
- 857 items have value -3 (Prefer not to answer)
- 24370 items have value -1 (Do not know)
|
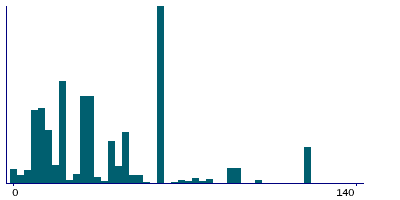
Instance 1 : First repeat assessment visit (2012-13)
12,972 participants, 12,972 items
| Maximum | 1000 |
| Decile 9 | 75 |
| Decile 8 | 60 |
| Decile 7 | 50 |
| Decile 6 | 40 |
| Median | 30 |
| Decile 4 | 30 |
| Decile 3 | 20 |
| Decile 2 | 15 |
| Decile 1 | 10 |
| Minimum | 0 |
|
|
- There are 80 distinct values.
- Mean = 41.8915
- Std.dev = 41.2011
- 271 items above graph maximum of 140
- 16 items have value -3 (Prefer not to answer)
- 710 items have value -1 (Do not know)
|
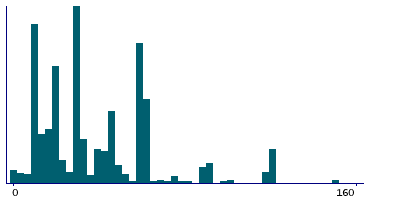
Instance 2 : Imaging visit (2014+)
67,462 participants, 67,462 items
| Maximum | 1000 |
| Decile 9 | 80 |
| Decile 8 | 60 |
| Decile 7 | 55 |
| Decile 6 | 45 |
| Median | 30 |
| Decile 4 | 30 |
| Decile 3 | 20 |
| Decile 2 | 15 |
| Decile 1 | 10 |
| Minimum | 0 |
|
|
- There are 123 distinct values.
- Mean = 42.9127
- Std.dev = 40.7834
- 1478 items above graph maximum of 150
- 109 items have value -3 (Prefer not to answer)
- 3738 items have value -1 (Do not know)
|
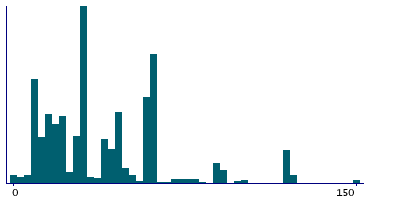
Instance 3 : First repeat imaging visit (2019+)
13,719 participants, 13,719 items
| Maximum | 600 |
| Decile 9 | 90 |
| Decile 8 | 60 |
| Decile 7 | 60 |
| Decile 6 | 45 |
| Median | 30 |
| Decile 4 | 30 |
| Decile 3 | 20 |
| Decile 2 | 15 |
| Decile 1 | 10 |
| Minimum | 0 |
|
|
- There are 85 distinct values.
- Mean = 44.629
- Std.dev = 43.0325
- 354 items above graph maximum of 170
- 30 items have value -3 (Prefer not to answer)
- 656 items have value -1 (Do not know)
|
Notes
ACE touchscreen question "How many minutes did you usually spend doing vigorous activities on a typical DAY?"
The following checks were performed:
- If answer < 0 then rejected
- If answer > 1440 then rejected
- If answer < 10 then participant asked to confirm
- If answer > 300 then participant asked to confirm
If the participant activated the Help button they were shown the message:
If the time you usually spend doing vigorous physical activity on each day
of the week varies a lot, give an average of the time you spend doing vigorous
physical activity.
|
This information was collected from participants who indicated that they did vigorous physical activities for 10 minutes on at least 1 day per week in the previous 4 weeks, as defined by their answers to Field 904
Coding 100291 defines 2 special values:
- -1 represents "Do not know"
- -3 represents "Prefer not to answer"
2 Related Data-Fields
| Field ID | Description | Relationship |
|---|
| 10971 | Duration of vigorous physical activi ... | Field 10971 is the pilot-study predecessor of main-study Current Field |
| 904 | Number of days/week of vigorous phys ... | Field 904 determined who was asked Current Field |
2 Applications
| Application ID | Title |
|---|
| 3173 | A multi-level approach to better understand the association between physical activity and sedentary behaviour, and cancer risk. |
| 4483 | Identification of modifiable and non-modifiable correlates of sedentary behaviours and physical activity in adults aged =65 years |


