Data
639,439 items of data are available, covering 498,518 participants.
Some values have special meanings defined by Data-Coding
100329.
Defined-instances run from 0 to 3, labelled using Instancing
2.
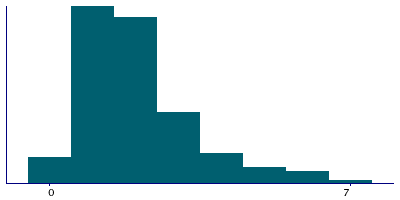
Units of measurement are hours/day.
| Maximum | 24 |
| Decile 9 | 3 |
| Decile 8 | 2 |
| Decile 7 | 2 |
| Decile 6 | 1 |
| Median | 1 |
| Decile 4 | 1 |
| Decile 3 | 1 |
| Decile 2 | 0 |
| Decile 1 | 0 |
| Minimum | 0 |
|
|
- There are 23 distinct values.
- Mean = 1.42496
- Std.dev = 1.56092
- 6840 items above graph maximum of 6
- 119415 items have value -10 (Less than an hour a day)
- 1652 items have value -3 (Prefer not to answer)
- 3640 items have value -1 (Do not know)
|
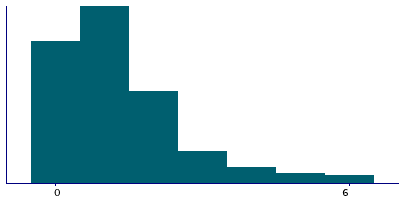
4 Instances
Instance 0 : Initial assessment visit (2006-2010) at which participants were recruited and consent given
497,288 participants, 497,288 items
| Maximum | 24 |
| Decile 9 | 3 |
| Decile 8 | 2 |
| Decile 7 | 1 |
| Decile 6 | 1 |
| Median | 1 |
| Decile 4 | 1 |
| Decile 3 | 0 |
| Decile 2 | 0 |
| Decile 1 | 0 |
| Minimum | 0 |
|
|
- There are 23 distinct values.
- Mean = 1.23708
- Std.dev = 1.52231
- 4860 items above graph maximum of 6
- 103276 items have value -10 (Less than an hour a day)
- 1576 items have value -3 (Prefer not to answer)
- 3129 items have value -1 (Do not know)
|
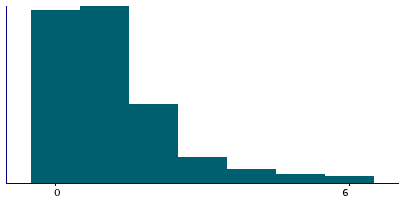
Instance 1 : First repeat assessment visit (2012-13)
20,314 participants, 20,314 items
| Maximum | 16 |
| Decile 9 | 3 |
| Decile 8 | 2 |
| Decile 7 | 2 |
| Decile 6 | 2 |
| Median | 1 |
| Decile 4 | 1 |
| Decile 3 | 1 |
| Decile 2 | 1 |
| Decile 1 | 0 |
| Minimum | 0 |
|
|
- There are 16 distinct values.
- Mean = 1.66711
- Std.dev = 1.45003
- 200 items above graph maximum of 6
- 3801 items have value -10 (Less than an hour a day)
- 11 items have value -3 (Prefer not to answer)
- 64 items have value -1 (Do not know)
|
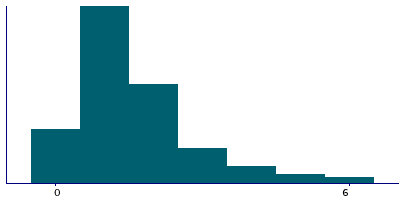
Instance 2 : Imaging visit (2014+)
100,917 participants, 100,917 items
| Maximum | 20 |
| Decile 9 | 4 |
| Decile 8 | 3 |
| Decile 7 | 2 |
| Decile 6 | 2 |
| Median | 2 |
| Decile 4 | 1 |
| Decile 3 | 1 |
| Decile 2 | 1 |
| Decile 1 | 1 |
| Minimum | 0 |
|
|
- There are 20 distinct values.
- Mean = 2.03276
- Std.dev = 1.54428
- 1078 items above graph maximum of 7
- 10693 items have value -10 (Less than an hour a day)
- 61 items have value -3 (Prefer not to answer)
- 365 items have value -1 (Do not know)
|
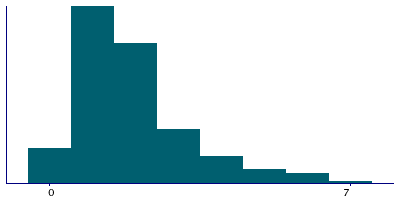
Instance 3 : First repeat imaging visit (2019+)
20,920 participants, 20,920 items
| Maximum | 24 |
| Decile 9 | 4 |
| Decile 8 | 3 |
| Decile 7 | 2 |
| Decile 6 | 2 |
| Median | 2 |
| Decile 4 | 2 |
| Decile 3 | 1 |
| Decile 2 | 1 |
| Decile 1 | 1 |
| Minimum | 0 |
|
|
- There are 19 distinct values.
- Mean = 2.18485
- Std.dev = 1.51885
- 205 items above graph maximum of 7
- 1645 items have value -10 (Less than an hour a day)
- 4 items have value -3 (Prefer not to answer)
- 82 items have value -1 (Do not know)
|
Notes
ACE touchscreen question "In a typical DAY, how many hours do you spend using the computer? (Do not include using a computer at work; put 0 if you do not spend any time doing it)"
The following checks were performed:
- If answer < 0 then rejected
- If answer > 24 then rejected
- If answer > 6 then participant asked to confirm
If the participant activated the Help button they were shown the message:
If the time you spend on the computer varies a lot, give the average
time for a 24 hour day in the last 4 weeks. Remember not to include
time spent on a computer at work.
|
This question was first asked in 2006 so needs to be interpreted in the light of technological development at that time when computers would generally mean either desktop or laptop PC systems. In 2019 the wording will be changed to
"In a typical DAY, how many hours do you spend using a computer/laptop, tablet or smartphone?"
Coding 100329 defines 3 special values:
- -10 represents "Less than an hour a day"
- -1 represents "Do not know"
- -3 represents "Prefer not to answer"
0 Related Data-Fields
There are no related data-fields
2 Applications
| Application ID | Title |
|---|
| 3173 | A multi-level approach to better understand the association between physical activity and sedentary behaviour, and cancer risk. |
| 4483 | Identification of modifiable and non-modifiable correlates of sedentary behaviours and physical activity in adults aged =65 years |


