Data
643,074 items of data are available, covering 500,989 participants.
Some values have special meanings defined by Data-Coding
100373.
Defined-instances run from 0 to 3, labelled using Instancing
2.
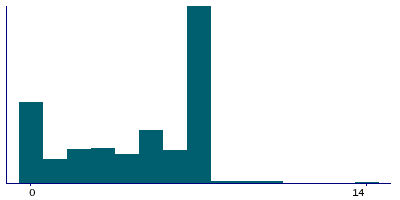
Units of measurement are bowls/week.
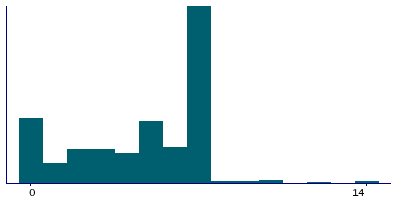
| Maximum | 77 |
| Decile 9 | 7 |
| Decile 8 | 7 |
| Decile 7 | 7 |
| Decile 6 | 6 |
| Median | 5 |
| Decile 4 | 5 |
| Decile 3 | 3 |
| Decile 2 | 2 |
| Decile 1 | 0 |
| Minimum | 0 |
|
|
- There are 31 distinct values.
- Mean = 4.64507
- Std.dev = 2.74067
- 326 items above graph maximum of 14
- 29265 items have value -10 (Less than one)
- 477 items have value -3 (Prefer not to answer)
- 1737 items have value -1 (Do not know)
|
4 Instances
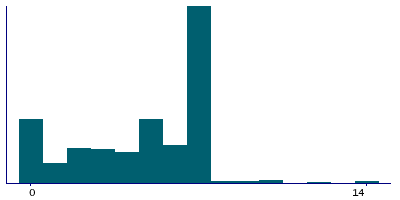
Instance 0 : Initial assessment visit (2006-2010) at which participants were recruited and consent given
500,923 participants, 500,923 items
| Maximum | 77 |
| Decile 9 | 7 |
| Decile 8 | 7 |
| Decile 7 | 7 |
| Decile 6 | 6 |
| Median | 5 |
| Decile 4 | 5 |
| Decile 3 | 3 |
| Decile 2 | 2 |
| Decile 1 | 0 |
| Minimum | 0 |
|
|
- There are 30 distinct values.
- Mean = 4.68354
- Std.dev = 2.71954
- 276 items above graph maximum of 14
- 22267 items have value -10 (Less than one)
- 456 items have value -3 (Prefer not to answer)
- 1614 items have value -1 (Do not know)
|
Instance 1 : First repeat assessment visit (2012-13)
20,314 participants, 20,314 items
| Maximum | 30 |
| Decile 9 | 7 |
| Decile 8 | 7 |
| Decile 7 | 7 |
| Decile 6 | 7 |
| Median | 6 |
| Decile 4 | 5 |
| Decile 3 | 4 |
| Decile 2 | 2 |
| Decile 1 | 0 |
| Minimum | 0 |
|
|
- There are 20 distinct values.
- Mean = 4.99318
- Std.dev = 2.69182
- 14 items above graph maximum of 14
- 801 items have value -10 (Less than one)
- 3 items have value -3 (Prefer not to answer)
- 17 items have value -1 (Do not know)
|
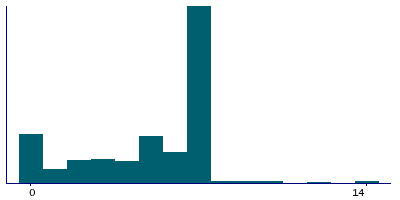
Instance 2 : Imaging visit (2014+)
100,917 participants, 100,917 items
| Maximum | 57 |
| Decile 9 | 7 |
| Decile 8 | 7 |
| Decile 7 | 7 |
| Decile 6 | 6 |
| Median | 5 |
| Decile 4 | 4 |
| Decile 3 | 3 |
| Decile 2 | 1 |
| Decile 1 | 0 |
| Minimum | 0 |
|
|
- There are 22 distinct values.
- Mean = 4.43622
- Std.dev = 2.81879
- 29 items above graph maximum of 14
- 5172 items have value -10 (Less than one)
- 17 items have value -3 (Prefer not to answer)
- 99 items have value -1 (Do not know)
|
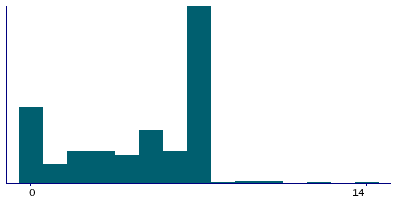
Instance 3 : First repeat imaging visit (2019+)
20,920 participants, 20,920 items
| Maximum | 21 |
| Decile 9 | 7 |
| Decile 8 | 7 |
| Decile 7 | 7 |
| Decile 6 | 6 |
| Median | 5 |
| Decile 4 | 4 |
| Decile 3 | 3 |
| Decile 2 | 1 |
| Decile 1 | 0 |
| Minimum | 0 |
|
|
- There are 18 distinct values.
- Mean = 4.38618
- Std.dev = 2.83127
- 7 items above graph maximum of 14
- 1025 items have value -10 (Less than one)
- 1 items have value -3 (Prefer not to answer)
- 7 items have value -1 (Do not know)
|
Notes
ACE touchscreen question "How many bowls of cereal do you eat a WEEK?"
The following checks were performed:
- If answer < 0 then rejected
- If answer > 99 then rejected
- If answer > 14 then participant asked to confirm
If the participant activated the Help button they were shown the message:
Please provide an average considering your intake over the last year.
If you are unsure, please provide an estimate or select Do not know.
|
Coding 100373 defines 3 special values:
- -10 represents "Less than one"
- -1 represents "Do not know"
- -3 represents "Prefer not to answer"


