Data
18,915 items of data are available, covering 18,186 participants.
Defined-instances run from 2 to 3, labelled using Instancing
2.
Units of measurement are g.
| Maximum | 27638 |
| Decile 9 | 14864 |
| Decile 8 | 13576 |
| Decile 7 | 12789 |
| Decile 6 | 12152 |
| Median | 11574 |
| Decile 4 | 11026 |
| Decile 3 | 10480 |
| Decile 2 | 9876 |
| Decile 1 | 9071 |
| Minimum | 1840 |
|
|
- There are 7914 distinct values.
- Mean = 11828.6
- Std.dev = 2373.92
- 68 items above graph maximum of 20657
|
2 Instances
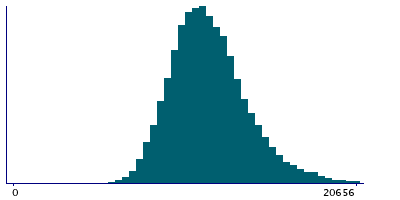
Instance 2 : Imaging visit (2014+)
16,931 participants, 16,931 items
| Maximum | 27638 |
| Decile 9 | 14849.5 |
| Decile 8 | 13539 |
| Decile 7 | 12766.5 |
| Decile 6 | 12139.5 |
| Median | 11564 |
| Decile 4 | 11017.5 |
| Decile 3 | 10478 |
| Decile 2 | 9870.5 |
| Decile 1 | 9063.5 |
| Minimum | 1840 |
|

|
- There are 7551 distinct values.
- Mean = 11814.6
- Std.dev = 2369.87
- 59 items above graph maximum of 20636
|
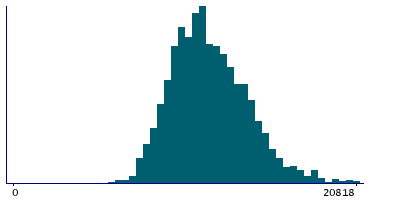
Instance 3 : First repeat imaging visit (2019+)
1,984 participants, 1,984 items
| Maximum | 25863 |
| Decile 9 | 14978 |
| Decile 8 | 13872 |
| Decile 7 | 12982 |
| Decile 6 | 12299.5 |
| Median | 11626 |
| Decile 4 | 11157 |
| Decile 3 | 10501.5 |
| Decile 2 | 9932.5 |
| Decile 1 | 9138 |
| Minimum | 5771 |
|
|
- There are 1760 distinct values.
- Mean = 11948
- Std.dev = 2404.93
- 8 items above graph maximum of 20818
|
Notes
Value output by DXA system
1 Related Data-Field
| Field ID | Description | Relationship |
|---|
| 21127 | Leg tissue mass (left) | Field 21127 is the opposite-side complement to Current Field |
0 Resources
There are no matching Resources
