Data
71,730 items of data are available, covering 67,287 participants.
Defined-instances run from 2 to 3, labelled using Instancing
2.
Units of measurement are g.
| Maximum | 2080 |
| Decile 9 | 1309 |
| Decile 8 | 1207 |
| Decile 7 | 1122 |
| Decile 6 | 1037 |
| Median | 945 |
| Decile 4 | 865 |
| Decile 3 | 802 |
| Decile 2 | 743 |
| Decile 1 | 678 |
| Minimum | 0 |
|
|
- There are 1334 distinct values.
- Mean = 974.349
- Std.dev = 244.232
- 2 items above graph maximum of 1940
|
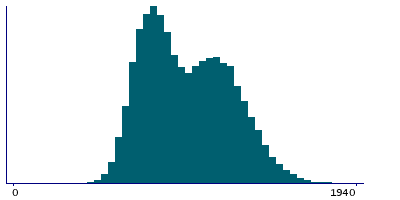
2 Instances
Instance 2 : Imaging visit (2014+)
65,369 participants, 65,369 items
| Maximum | 2080 |
| Decile 9 | 1309 |
| Decile 8 | 1206 |
| Decile 7 | 1122 |
| Decile 6 | 1036 |
| Median | 944 |
| Decile 4 | 864 |
| Decile 3 | 801 |
| Decile 2 | 743 |
| Decile 1 | 678 |
| Minimum | 0 |
|

|
- There are 1329 distinct values.
- Mean = 973.711
- Std.dev = 244.254
- 2 items above graph maximum of 1940
|
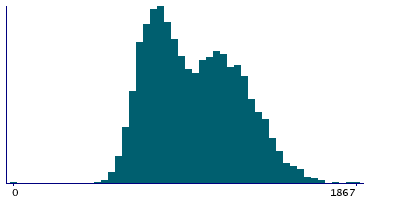
Instance 3 : First repeat imaging visit (2019+)
6,361 participants, 6,361 items
| Maximum | 1867 |
| Decile 9 | 1313.5 |
| Decile 8 | 1212 |
| Decile 7 | 1130 |
| Decile 6 | 1049 |
| Median | 958 |
| Decile 4 | 875 |
| Decile 3 | 808 |
| Decile 2 | 747 |
| Decile 1 | 679 |
| Minimum | 0 |
|
|
- There are 1048 distinct values.
- Mean = 980.907
- Std.dev = 243.909
|
Notes
Value output by DXA system
0 Related Data-Fields
There are no related data-fields
0 Resources
There are no matching Resources
