Data
74,451 items of data are available, covering 69,057 participants.
Defined-instances run from 2 to 3, labelled using Instancing
2.
Units of measurement are g/cm2.
| Maximum | 2.27188 |
| Decile 9 | 1.41 |
| Decile 8 | 1.32194 |
| Decile 7 | 1.25848 |
| Decile 6 | 1.20565 |
| Median | 1.15763 |
| Decile 4 | 1.10983 |
| Decile 3 | 1.06039 |
| Decile 2 | 1.00417 |
| Decile 1 | 0.930684 |
| Minimum | 0 |
|

|
- Mean = 1.1654
- Std.dev = 0.187503
- 28 items above graph maximum of 1.88931
|
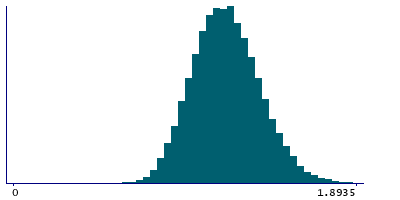
2 Instances
Instance 2 : Imaging visit (2014+)
68,703 participants, 68,703 items
| Maximum | 2.27188 |
| Decile 9 | 1.41105 |
| Decile 8 | 1.32238 |
| Decile 7 | 1.25852 |
| Decile 6 | 1.20578 |
| Median | 1.15761 |
| Decile 4 | 1.10962 |
| Decile 3 | 1.06009 |
| Decile 2 | 1.00399 |
| Decile 1 | 0.930409 |
| Minimum | 0 |
|
|
- Mean = 1.1655
- Std.dev = 0.187932
- 28 items above graph maximum of 1.89169
|
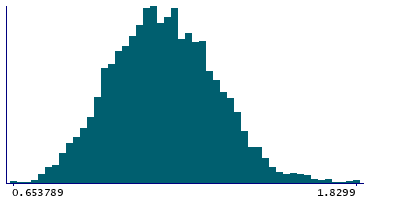
Instance 3 : First repeat imaging visit (2019+)
5,748 participants, 5,748 items
| Maximum | 1.83835 |
| Decile 9 | 1.40044 |
| Decile 8 | 1.31802 |
| Decile 7 | 1.25753 |
| Decile 6 | 1.20409 |
| Median | 1.1583 |
| Decile 4 | 1.1121 |
| Decile 3 | 1.0636 |
| Decile 2 | 1.00602 |
| Decile 1 | 0.933735 |
| Minimum | 0.618992 |
|
|
- Mean = 1.16422
- Std.dev = 0.182299
|