Data
39,618 items of data are available, covering 37,214 participants.
Defined-instances run from 2 to 3, labelled using Instancing
2.
Units of measurement are g.
| Maximum | 393.39 |
| Decile 9 | 254.997 |
| Decile 8 | 234.563 |
| Decile 7 | 217.44 |
| Decile 6 | 199.639 |
| Median | 175.71 |
| Decile 4 | 155.972 |
| Decile 3 | 143.51 |
| Decile 2 | 132.607 |
| Decile 1 | 120.541 |
| Minimum | 11.8908 |
|

|
- Mean = 183.267
- Std.dev = 52.4232
- 1 item above graph maximum of 389.453
|
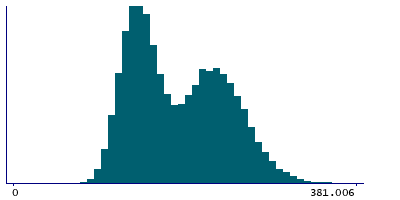
2 Instances
Instance 2 : Imaging visit (2014+)
35,837 participants, 35,837 items
| Maximum | 393.39 |
| Decile 9 | 254.949 |
| Decile 8 | 234.432 |
| Decile 7 | 217.305 |
| Decile 6 | 199.379 |
| Median | 175.535 |
| Decile 4 | 155.937 |
| Decile 3 | 143.42 |
| Decile 2 | 132.61 |
| Decile 1 | 120.574 |
| Minimum | 11.8908 |
|
|
- Mean = 183.193
- Std.dev = 52.3841
- 1 item above graph maximum of 389.325
|
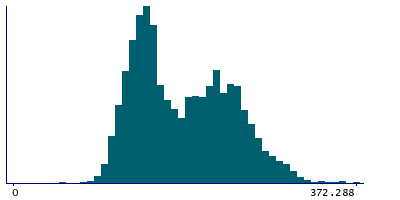
Instance 3 : First repeat imaging visit (2019+)
3,781 participants, 3,781 items
| Maximum | 372.288 |
| Decile 9 | 255.136 |
| Decile 8 | 235.879 |
| Decile 7 | 218.844 |
| Decile 6 | 201.357 |
| Median | 177.623 |
| Decile 4 | 156.611 |
| Decile 3 | 144.346 |
| Decile 2 | 132.602 |
| Decile 1 | 120.218 |
| Minimum | 52.3076 |
|
|
- Mean = 183.971
- Std.dev = 52.787
|