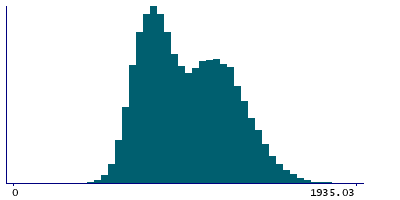
Data
78,765 items of data are available, covering 72,674 participants.
Defined-instances run from 2 to 3, labelled using Instancing
2.
Units of measurement are g.
| Maximum | 2080.26 |
| Decile 9 | 1309.34 |
| Decile 8 | 1206.79 |
| Decile 7 | 1122.38 |
| Decile 6 | 1037.39 |
| Median | 946.415 |
| Decile 4 | 866.473 |
| Decile 3 | 803.576 |
| Decile 2 | 744.758 |
| Decile 1 | 679.563 |
| Minimum | 0 |
|
|
- Mean = 975.284
- Std.dev = 243.365
- 2 items above graph maximum of 1939.12
|
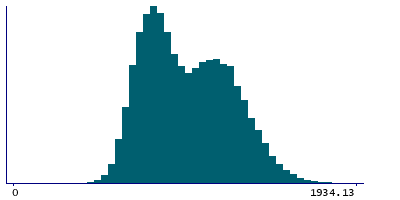
2 Instances
Instance 2 : Imaging visit (2014+)
72,404 participants, 72,404 items
| Maximum | 2080.26 |
| Decile 9 | 1309.03 |
| Decile 8 | 1206.21 |
| Decile 7 | 1121.76 |
| Decile 6 | 1036.41 |
| Median | 945.41 |
| Decile 4 | 865.917 |
| Decile 3 | 803.085 |
| Decile 2 | 744.531 |
| Decile 1 | 679.563 |
| Minimum | 0 |
|
|
- Mean = 974.774
- Std.dev = 243.311
- 2 items above graph maximum of 1938.49
|
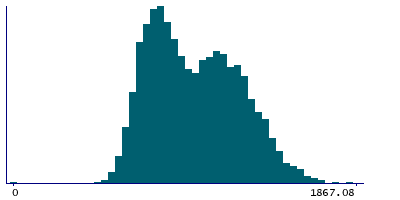
Instance 3 : First repeat imaging visit (2019+)
6,361 participants, 6,361 items
| Maximum | 1867.08 |
| Decile 9 | 1314.34 |
| Decile 8 | 1212.23 |
| Decile 7 | 1130.78 |
| Decile 6 | 1048.98 |
| Median | 957.924 |
| Decile 4 | 875.308 |
| Decile 3 | 808.365 |
| Decile 2 | 747.388 |
| Decile 1 | 679.62 |
| Minimum | 0 |
|
|
- Mean = 981.088
- Std.dev = 243.901
- 1 item above graph maximum of 1867.08
|