Data
78,765 items of data are available, covering 72,674 participants.
Defined-instances run from 2 to 3, labelled using Instancing
2.
Units of measurement are g/cm2.
| Maximum | 2.40178 |
| Decile 9 | 1.1701 |
| Decile 8 | 1.1005 |
| Decile 7 | 1.04949 |
| Decile 6 | 1.00625 |
| Median | 0.964936 |
| Decile 4 | 0.92515 |
| Decile 3 | 0.882571 |
| Decile 2 | 0.836813 |
| Decile 1 | 0.779824 |
| Minimum | 0 |
|

|
- Mean = 0.971563
- Std.dev = 0.151187
- 26 items above graph maximum of 1.56037
|
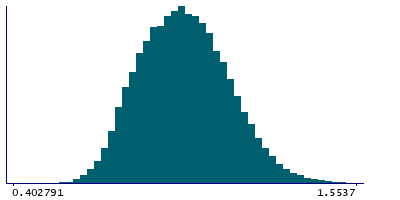
2 Instances
Instance 2 : Imaging visit (2014+)
72,404 participants, 72,404 items
| Maximum | 2.40178 |
| Decile 9 | 1.17085 |
| Decile 8 | 1.10131 |
| Decile 7 | 1.05019 |
| Decile 6 | 1.0069 |
| Median | 0.965376 |
| Decile 4 | 0.925279 |
| Decile 3 | 0.882859 |
| Decile 2 | 0.837139 |
| Decile 1 | 0.78021 |
| Minimum | 0 |
|
|
- Mean = 0.972061
- Std.dev = 0.151417
- 23 items above graph maximum of 1.56148
|
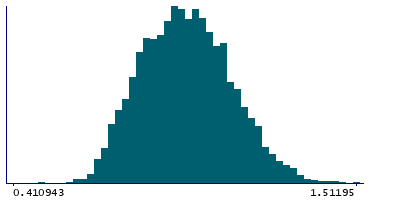
Instance 3 : First repeat imaging visit (2019+)
6,361 participants, 6,361 items
| Maximum | 1.62908 |
| Decile 9 | 1.16092 |
| Decile 8 | 1.09097 |
| Decile 7 | 1.04208 |
| Decile 6 | 0.999861 |
| Median | 0.960243 |
| Decile 4 | 0.922649 |
| Decile 3 | 0.87941 |
| Decile 2 | 0.833086 |
| Decile 1 | 0.776259 |
| Minimum | 0 |
|
|
- Mean = 0.965902
- Std.dev = 0.148435
- 1 item below graph minimum of 0.391601
- 2 items above graph maximum of 1.54558
|