Data
38,775 items of data are available, covering 36,999 participants.
Defined-instances run from 2 to 3, labelled using Instancing
2.
Units of measurement are g/cm2.
| Maximum | 1.90804 |
| Decile 9 | 0.94298 |
| Decile 8 | 0.866 |
| Decile 7 | 0.814083 |
| Decile 6 | 0.77255 |
| Median | 0.736018 |
| Decile 4 | 0.701 |
| Decile 3 | 0.666127 |
| Decile 2 | 0.628147 |
| Decile 1 | 0.580249 |
| Minimum | 0 |
|
|
- Mean = 0.751303
- Std.dev = 0.145198
- 57 items above graph maximum of 1.30571
|
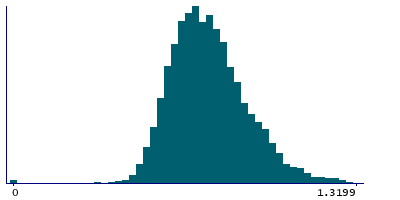
2 Instances
Instance 2 : Imaging visit (2014+)
36,388 participants, 36,388 items
| Maximum | 1.90804 |
| Decile 9 | 0.943 |
| Decile 8 | 0.865845 |
| Decile 7 | 0.814094 |
| Decile 6 | 0.772764 |
| Median | 0.736131 |
| Decile 4 | 0.700955 |
| Decile 3 | 0.66619 |
| Decile 2 | 0.628088 |
| Decile 1 | 0.58 |
| Minimum | 0 |
|

|
- Mean = 0.751384
- Std.dev = 0.145452
- 55 items above graph maximum of 1.306
|
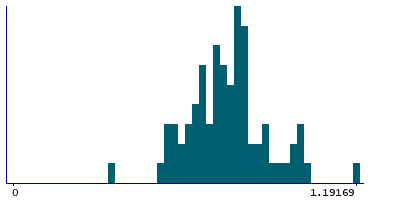
Instance 3 : First repeat imaging visit (2019+)
2,387 participants, 2,387 items
| Maximum | 1.36887 |
| Decile 9 | 0.942565 |
| Decile 8 | 0.86743 |
| Decile 7 | 0.813597 |
| Decile 6 | 0.770753 |
| Median | 0.734618 |
| Decile 4 | 0.702214 |
| Decile 3 | 0.665165 |
| Decile 2 | 0.629697 |
| Decile 1 | 0.583993 |
| Minimum | 0.213312 |
|
|
- Mean = 0.75006
- Std.dev = 0.141268
- 2 items above graph maximum of 1.30114
|