Data
51,743 items of data are available, covering 48,168 participants.
Defined-instances run from 2 to 3, labelled using Instancing
2.
Units of measurement are Std.Devs.
| Maximum | 10.478 |
| Decile 9 | 1.43502 |
| Decile 8 | 0.816319 |
| Decile 7 | 0.385821 |
| Decile 6 | 0.0285062 |
| Median | -0.295645 |
| Decile 4 | -0.602605 |
| Decile 3 | -0.9295 |
| Decile 2 | -1.30124 |
| Decile 1 | -1.79754 |
| Minimum | -4.82999 |
|
|
- Mean = -0.225688
- Std.dev = 1.27399
- 40 items above graph maximum of 4.66758
|
2 Instances
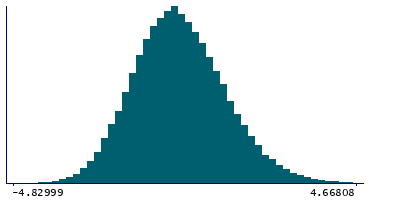
Instance 2 : Imaging visit (2014+)
47,736 participants, 47,736 items
| Maximum | 10.478 |
| Decile 9 | 1.44802 |
| Decile 8 | 0.822073 |
| Decile 7 | 0.391589 |
| Decile 6 | 0.034621 |
| Median | -0.286959 |
| Decile 4 | -0.59617 |
| Decile 3 | -0.923311 |
| Decile 2 | -1.29589 |
| Decile 1 | -1.79254 |
| Minimum | -4.82999 |
|

|
- Mean = -0.218636
- Std.dev = 1.27541
- 37 items above graph maximum of 4.68859
|
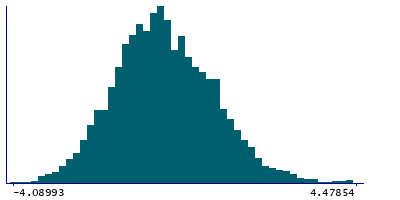
Instance 3 : First repeat imaging visit (2019+)
4,007 participants, 4,007 items
| Maximum | 5.08578 |
| Decile 9 | 1.30528 |
| Decile 8 | 0.742608 |
| Decile 7 | 0.296135 |
| Decile 6 | -0.0513188 |
| Median | -0.388679 |
| Decile 4 | -0.676012 |
| Decile 3 | -1.00585 |
| Decile 2 | -1.35745 |
| Decile 1 | -1.86528 |
| Minimum | -4.08993 |
|
|
- Mean = -0.309696
- Std.dev = 1.25381
- 4 items above graph maximum of 4.47585
|