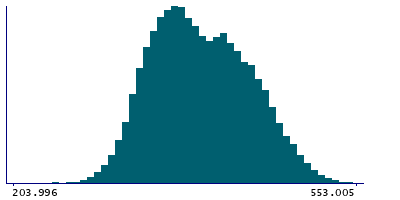
Data
39,618 items of data are available, covering 37,214 participants.
Defined-instances run from 2 to 3, labelled using Instancing
2.
Units of measurement are cm2.
| Maximum | 574.065 |
| Decile 9 | 461.159 |
| Decile 8 | 439.622 |
| Decile 7 | 422.045 |
| Decile 6 | 406.491 |
| Median | 390.624 |
| Decile 4 | 376.173 |
| Decile 3 | 362.811 |
| Decile 2 | 348.837 |
| Decile 1 | 331.646 |
| Minimum | 78.2767 |
|
|
- Mean = 393.85
- Std.dev = 49.7007
- 3 items below graph minimum of 202.134
|
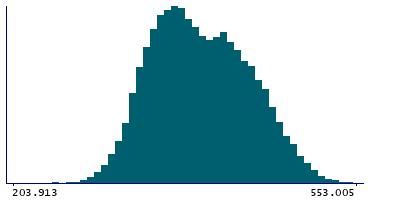
2 Instances
Instance 2 : Imaging visit (2014+)
35,837 participants, 35,837 items
| Maximum | 574.065 |
| Decile 9 | 461.117 |
| Decile 8 | 439.487 |
| Decile 7 | 421.951 |
| Decile 6 | 406.469 |
| Median | 390.519 |
| Decile 4 | 376.061 |
| Decile 3 | 362.788 |
| Decile 2 | 348.851 |
| Decile 1 | 331.692 |
| Minimum | 78.2767 |
|
|
- Mean = 393.769
- Std.dev = 49.6511
- 3 items below graph minimum of 202.268
|
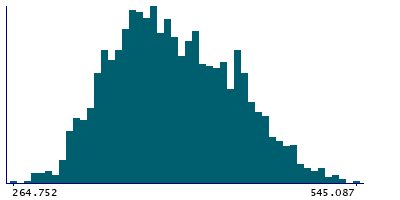
Instance 3 : First repeat imaging visit (2019+)
3,781 participants, 3,781 items
| Maximum | 551.168 |
| Decile 9 | 461.952 |
| Decile 8 | 441.722 |
| Decile 7 | 422.577 |
| Decile 6 | 407.261 |
| Median | 391.928 |
| Decile 4 | 377.308 |
| Decile 3 | 363.061 |
| Decile 2 | 348.616 |
| Decile 1 | 331.143 |
| Minimum | 256.05 |
|
|
- Mean = 394.621
- Std.dev = 50.1611
|