Data
78,098 items of data are available, covering 72,083 participants.
Defined-instances run from 2 to 3, labelled using Instancing
2.
Units of measurement are cm3.
| Maximum | 22.5276 |
| Decile 9 | 16.4395 |
| Decile 8 | 15.8935 |
| Decile 7 | 15.4694 |
| Decile 6 | 15.0982 |
| Median | 14.7582 |
| Decile 4 | 14.4294 |
| Decile 3 | 14.1071 |
| Decile 2 | 13.7521 |
| Decile 1 | 13.2973 |
| Minimum | 0 |
|

|
- Mean = 14.818
- Std.dev = 1.22887
- 26 items below graph minimum of 10.1551
- 20 items above graph maximum of 19.5816
|
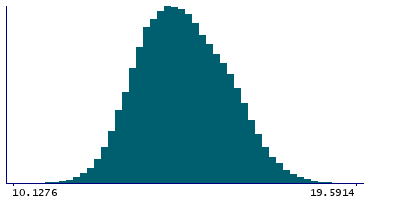
2 Instances
Instance 2 : Imaging visit (2014+)
71,790 participants, 71,790 items
| Maximum | 22.5276 |
| Decile 9 | 16.4418 |
| Decile 8 | 15.8959 |
| Decile 7 | 15.4709 |
| Decile 6 | 15.0992 |
| Median | 14.76 |
| Decile 4 | 14.4305 |
| Decile 3 | 14.1078 |
| Decile 2 | 13.7542 |
| Decile 1 | 13.2999 |
| Minimum | 0 |
|
|
- Mean = 14.8201
- Std.dev = 1.22888
- 24 items below graph minimum of 10.158
- 20 items above graph maximum of 19.5837
|
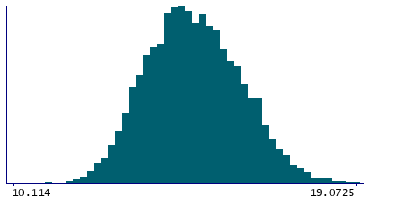
Instance 3 : First repeat imaging visit (2019+)
6,308 participants, 6,308 items
| Maximum | 19.0725 |
| Decile 9 | 16.4205 |
| Decile 8 | 15.8689 |
| Decile 7 | 15.4521 |
| Decile 6 | 15.0795 |
| Median | 14.7333 |
| Decile 4 | 14.4225 |
| Decile 3 | 14.1 |
| Decile 2 | 13.7129 |
| Decile 1 | 13.2662 |
| Minimum | 0 |
|
|
- Mean = 14.7946
- Std.dev = 1.22853
- 2 items below graph minimum of 10.1119
|
Notes
Bone area for the left femoral shaft, from DXA output.
0 Related Data-Fields
There are no related data-fields
1 Application
| Application ID | Title |
|---|
| 17295 | AUtomated Generation of Musculoskeletal phENotypes from the UK biobank exTended imaging study (AUGMENT Study) |