Data
74,397 items of data are available, covering 69,019 participants.
Defined-instances run from 2 to 3, labelled using Instancing
2.
Units of measurement are cm3.
| Maximum | 22.8871 |
| Decile 9 | 16.3755 |
| Decile 8 | 15.832 |
| Decile 7 | 15.4222 |
| Decile 6 | 15.0706 |
| Median | 14.7447 |
| Decile 4 | 14.4309 |
| Decile 3 | 14.1258 |
| Decile 2 | 13.7789 |
| Decile 1 | 13.3439 |
| Minimum | 0 |
|

|
- Mean = 14.8076
- Std.dev = 1.1851
- 17 items below graph minimum of 10.3124
- 24 items above graph maximum of 19.407
|
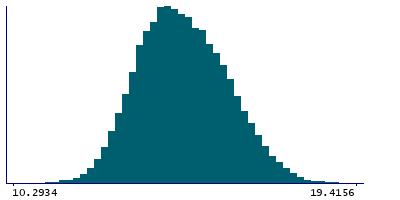
2 Instances
Instance 2 : Imaging visit (2014+)
68,649 participants, 68,649 items
| Maximum | 22.8871 |
| Decile 9 | 16.3767 |
| Decile 8 | 15.8346 |
| Decile 7 | 15.424 |
| Decile 6 | 15.0722 |
| Median | 14.7472 |
| Decile 4 | 14.4325 |
| Decile 3 | 14.1288 |
| Decile 2 | 13.7812 |
| Decile 1 | 13.3473 |
| Minimum | 0 |
|
|
- Mean = 14.8096
- Std.dev = 1.18549
- 17 items below graph minimum of 10.3179
- 23 items above graph maximum of 19.4061
|
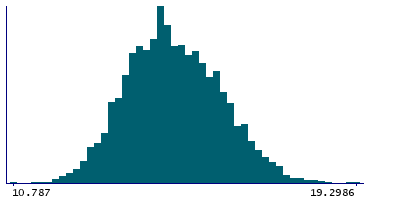
Instance 3 : First repeat imaging visit (2019+)
5,748 participants, 5,748 items
| Maximum | 21.7103 |
| Decile 9 | 16.3468 |
| Decile 8 | 15.8078 |
| Decile 7 | 15.4047 |
| Decile 6 | 15.0494 |
| Median | 14.713 |
| Decile 4 | 14.4169 |
| Decile 3 | 14.0971 |
| Decile 2 | 13.7514 |
| Decile 1 | 13.3001 |
| Minimum | 10.2569 |
|
|
- Mean = 14.7826
- Std.dev = 1.1802
- 1 item above graph maximum of 19.3936
|
Notes
Bone area for the right femoral shaft, from DXA output.
0 Related Data-Fields
There are no related data-fields
1 Application
| Application ID | Title |
|---|
| 17295 | AUtomated Generation of Musculoskeletal phENotypes from the UK biobank exTended imaging study (AUGMENT Study) |