Data
8,865 items of data are available, covering 8,865 participants.
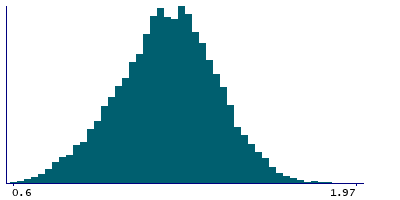
Defined-instances run from 2 to 3, labelled using Instancing
2.
| Maximum | 2.66 |
| Decile 9 | 1.46 |
| Decile 8 | 1.38 |
| Decile 7 | 1.32 |
| Decile 6 | 1.27 |
| Median | 1.22 |
| Decile 4 | 1.17 |
| Decile 3 | 1.12 |
| Decile 2 | 1.05 |
| Decile 1 | 0.95 |
| Minimum | 0.6 |
|
|
- Mean = 1.21289
- Std.dev = 0.200435
- 5 items above graph maximum of 1.97
|
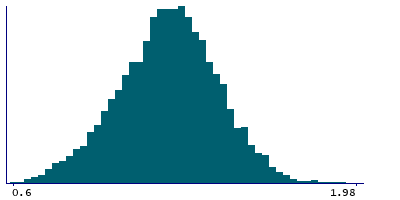
2 Instances
Instance 2 : Imaging visit (2014+)
7,066 participants, 7,066 items
| Maximum | 2.66 |
| Decile 9 | 1.46 |
| Decile 8 | 1.38 |
| Decile 7 | 1.32 |
| Decile 6 | 1.27 |
| Median | 1.23 |
| Decile 4 | 1.18 |
| Decile 3 | 1.12 |
| Decile 2 | 1.055 |
| Decile 1 | 0.96 |
| Minimum | 0.6 |
|
|
- Mean = 1.22025
- Std.dev = 0.199975
- 5 items above graph maximum of 1.96
|
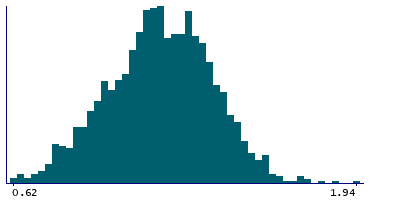
Instance 3 : First repeat imaging visit (2019+)
1,799 participants, 1,799 items
| Maximum | 1.94 |
| Decile 9 | 1.43 |
| Decile 8 | 1.35 |
| Decile 7 | 1.3 |
| Decile 6 | 1.24 |
| Median | 1.185 |
| Decile 4 | 1.14 |
| Decile 3 | 1.09 |
| Decile 2 | 1.01 |
| Decile 1 | 0.92 |
| Minimum | 0.62 |
|
|
- Mean = 1.18399
- Std.dev = 0.199625
|
Notes
Precision-weighted mean ATT (arterial transit time) in the right Thalamus
0 Related Data-Fields
There are no related data-fields


