Data
92,968 items of data are available, covering 87,755 participants.
Defined-instances run from 2 to 3, labelled using Instancing
2.
| Maximum | 4000 |
| Decile 9 | 4000 |
| Decile 8 | 3000 |
| Decile 7 | 3000 |
| Decile 6 | 2001 |
| Median | 2000 |
| Decile 4 | 1006 |
| Decile 3 | 1004 |
| Decile 2 | 1003 |
| Decile 1 | 1000 |
| Minimum | 1000 |
|

|
- There are 11 distinct values.
- Mean = 2041.28
- Std.dev = 1081.73
|
2 Instances
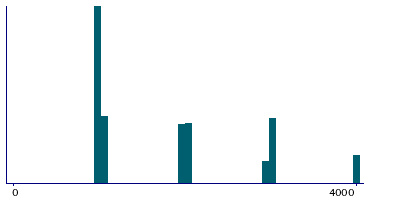
Instance 2 : Imaging visit (2014+)
87,754 participants, 87,754 items
| Maximum | 4000 |
| Decile 9 | 4000 |
| Decile 8 | 3000 |
| Decile 7 | 3000 |
| Decile 6 | 2001 |
| Median | 2000 |
| Decile 4 | 1006 |
| Decile 3 | 1004 |
| Decile 2 | 1002 |
| Decile 1 | 1000 |
| Minimum | 1000 |
|
|
- There are 11 distinct values.
- Mean = 2071.18
- Std.dev = 1094.71
|
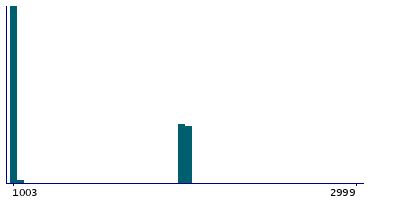
Instance 3 : First repeat imaging visit (2019+)
5,214 participants, 5,214 items
| Maximum | 3000 |
| Decile 9 | 2001 |
| Decile 8 | 2001 |
| Decile 7 | 2001 |
| Decile 6 | 2000 |
| Median | 1004 |
| Decile 4 | 1004 |
| Decile 3 | 1004 |
| Decile 2 | 1004 |
| Decile 1 | 1003 |
| Minimum | 1003 |
|
|
- There are 5 distinct values.
- Mean = 1538.04
- Std.dev = 652.883
- 468 items above graph maximum of 2999
|