Data
84,756 items of data are available, covering 80,210 participants.
Defined-instances run from 2 to 3, labelled using Instancing
2.
| Maximum | 1.8398 |
| Decile 9 | 0.508938 |
| Decile 8 | 0.494539 |
| Decile 7 | 0.484161 |
| Decile 6 | 0.475222 |
| Median | 0.46645 |
| Decile 4 | 0.457336 |
| Decile 3 | 0.446819 |
| Decile 2 | 0.434309 |
| Decile 1 | 0.414988 |
| Minimum | 0.159204 |
|

|
- Mean = 0.46427
- Std.dev = 0.0394878
- 97 items below graph minimum of 0.321038
- 163 items above graph maximum of 0.602888
|
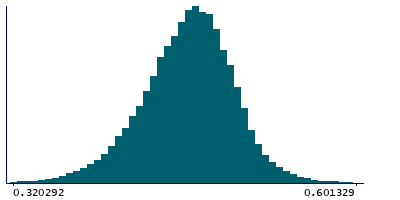
2 Instances
Instance 2 : Imaging visit (2014+)
80,001 participants, 80,001 items
| Maximum | 1.06914 |
| Decile 9 | 0.509216 |
| Decile 8 | 0.494756 |
| Decile 7 | 0.484273 |
| Decile 6 | 0.475318 |
| Median | 0.466504 |
| Decile 4 | 0.457406 |
| Decile 3 | 0.446852 |
| Decile 2 | 0.434295 |
| Decile 1 | 0.414893 |
| Minimum | 0.159204 |
|
|
- Mean = 0.46437
- Std.dev = 0.0393546
- 89 items below graph minimum of 0.32057
- 153 items above graph maximum of 0.603539
|
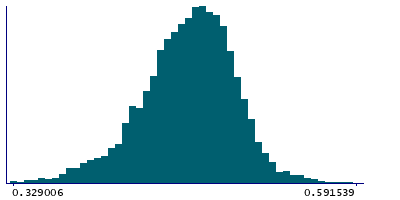
Instance 3 : First repeat imaging visit (2019+)
4,755 participants, 4,755 items
| Maximum | 1.8398 |
| Decile 9 | 0.504028 |
| Decile 8 | 0.491618 |
| Decile 7 | 0.482399 |
| Decile 6 | 0.473846 |
| Median | 0.465538 |
| Decile 4 | 0.456022 |
| Decile 3 | 0.446279 |
| Decile 2 | 0.43455 |
| Decile 1 | 0.416517 |
| Minimum | 0.291112 |
|
|
- Mean = 0.462599
- Std.dev = 0.0416296
- 9 items below graph minimum of 0.329006
- 6 items above graph maximum of 0.591539
|
Notes
90th percentile of the D variable from DVARS from the cleaned (after FIX) rfMRI
0 Related Data-Fields
There are no related data-fields


