Data
90,186 items of data are available, covering 85,097 participants.
Defined-instances run from 2 to 3, labelled using Instancing
2.
| Maximum | 0.525245 |
| Decile 9 | 0.0643243 |
| Decile 8 | 0.053017 |
| Decile 7 | 0.0462606 |
| Decile 6 | 0.0411666 |
| Median | 0.0369873 |
| Decile 4 | 0.0333107 |
| Decile 3 | 0.0297287 |
| Decile 2 | 0.026112 |
| Decile 1 | 0.021941 |
| Minimum | 0.00760022 |
|
|
- Mean = 0.0409707
- Std.dev = 0.0190534
- 845 items above graph maximum of 0.106708
|
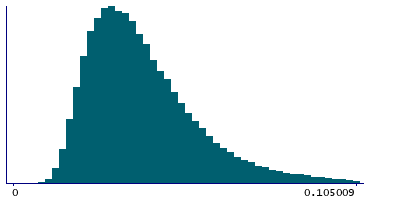
2 Instances
Instance 2 : Imaging visit (2014+)
85,001 participants, 85,001 items
| Maximum | 0.525245 |
| Decile 9 | 0.0645816 |
| Decile 8 | 0.0532592 |
| Decile 7 | 0.0464411 |
| Decile 6 | 0.0413163 |
| Median | 0.0371255 |
| Decile 4 | 0.033429 |
| Decile 3 | 0.0298348 |
| Decile 2 | 0.0261855 |
| Decile 1 | 0.0219911 |
| Minimum | 0.00760022 |
|

|
- Mean = 0.041122
- Std.dev = 0.0191364
- 798 items above graph maximum of 0.107172
|
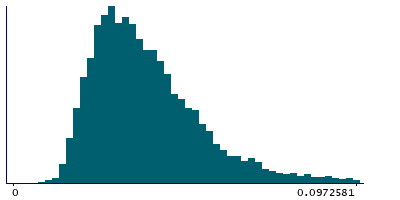
Instance 3 : First repeat imaging visit (2019+)
5,185 participants, 5,185 items
| Maximum | 0.355612 |
| Decile 9 | 0.0592662 |
| Decile 8 | 0.049435 |
| Decile 7 | 0.0432923 |
| Decile 6 | 0.0388827 |
| Median | 0.0349901 |
| Decile 4 | 0.0315868 |
| Decile 3 | 0.0281242 |
| Decile 2 | 0.0250276 |
| Decile 1 | 0.0212744 |
| Minimum | 0.00787622 |
|
|
- Mean = 0.03849
- Std.dev = 0.0174513
- 46 items above graph maximum of 0.0972581
|
Notes
Mean (across time) of the mean (across space) in-plane displacement from rfMRI
0 Related Data-Fields
There are no related data-fields


