Data
90,186 items of data are available, covering 85,097 participants.
Defined-instances run from 2 to 3, labelled using Instancing
2.
| Maximum | 0.868775 |
| Decile 9 | 0.0903113 |
| Decile 8 | 0.068754 |
| Decile 7 | 0.0571637 |
| Decile 6 | 0.0490218 |
| Median | 0.042509 |
| Decile 4 | 0.0370311 |
| Decile 3 | 0.031955 |
| Decile 2 | 0.0269014 |
| Decile 1 | 0.0214068 |
| Minimum | 0.00117249 |
|

|
- Mean = 0.0511879
- Std.dev = 0.0338696
- 1355 items above graph maximum of 0.159216
|
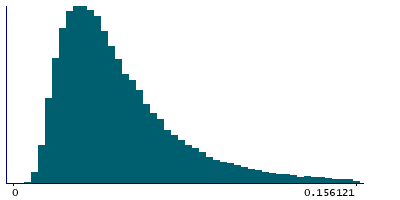
2 Instances
Instance 2 : Imaging visit (2014+)
85,001 participants, 85,001 items
| Maximum | 0.868775 |
| Decile 9 | 0.0904362 |
| Decile 8 | 0.0688994 |
| Decile 7 | 0.0572323 |
| Decile 6 | 0.0490838 |
| Median | 0.0425526 |
| Decile 4 | 0.0370485 |
| Decile 3 | 0.0319693 |
| Decile 2 | 0.026866 |
| Decile 1 | 0.0213886 |
| Minimum | 0.00117249 |
|
|
- Mean = 0.0512656
- Std.dev = 0.0340455
- 1294 items above graph maximum of 0.159484
|
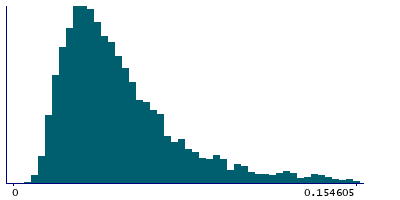
Instance 3 : First repeat imaging visit (2019+)
5,185 participants, 5,185 items
| Maximum | 0.375828 |
| Decile 9 | 0.088155 |
| Decile 8 | 0.0663861 |
| Decile 7 | 0.0556636 |
| Decile 6 | 0.0480051 |
| Median | 0.0418941 |
| Decile 4 | 0.0366765 |
| Decile 3 | 0.031829 |
| Decile 2 | 0.0274118 |
| Decile 1 | 0.0217046 |
| Minimum | 0.00696207 |
|
|
- Mean = 0.0499146
- Std.dev = 0.0308155
- 65 items above graph maximum of 0.154605
|
Notes
90th percentile (across time) of the mean (across space) of Z displacement from rfMRI
0 Related Data-Fields
There are no related data-fields


