Data
90,186 items of data are available, covering 85,097 participants.
Defined-instances run from 2 to 3, labelled using Instancing
2.
| Maximum | 0.655671 |
| Decile 9 | 0.0711149 |
| Decile 8 | 0.0586124 |
| Decile 7 | 0.0514022 |
| Decile 6 | 0.0460381 |
| Median | 0.0415957 |
| Decile 4 | 0.0377428 |
| Decile 3 | 0.0339974 |
| Decile 2 | 0.0302514 |
| Decile 1 | 0.0257684 |
| Minimum | 0.00857662 |
|
|
- Mean = 0.0460823
- Std.dev = 0.0209847
- 1005 items above graph maximum of 0.116461
|
2 Instances
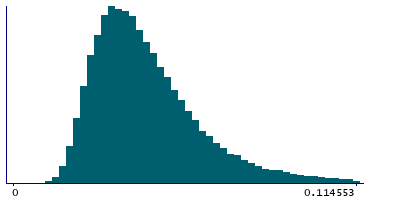
Instance 2 : Imaging visit (2014+)
85,001 participants, 85,001 items
| Maximum | 0.655671 |
| Decile 9 | 0.0714173 |
| Decile 8 | 0.0588289 |
| Decile 7 | 0.0515363 |
| Decile 6 | 0.0461757 |
| Median | 0.0416895 |
| Decile 4 | 0.0378284 |
| Decile 3 | 0.0340705 |
| Decile 2 | 0.0302941 |
| Decile 1 | 0.0257936 |
| Minimum | 0.00857662 |
|

|
- Mean = 0.0462198
- Std.dev = 0.0210942
- 942 items above graph maximum of 0.117041
|
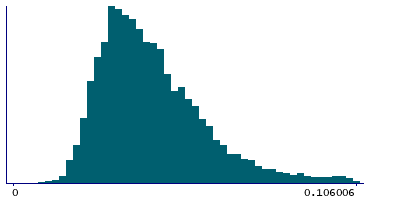
Instance 3 : First repeat imaging visit (2019+)
5,185 participants, 5,185 items
| Maximum | 0.382526 |
| Decile 9 | 0.0657222 |
| Decile 8 | 0.055301 |
| Decile 7 | 0.0488756 |
| Decile 6 | 0.0440964 |
| Median | 0.039991 |
| Decile 4 | 0.0362602 |
| Decile 3 | 0.0327303 |
| Decile 2 | 0.0296211 |
| Decile 1 | 0.0254384 |
| Minimum | 0.00891477 |
|
|
- Mean = 0.0438275
- Std.dev = 0.0189588
- 58 items above graph maximum of 0.106006
|
Notes
90th percentile (across space) of the mean (across time) in-plane displacement from rfMRI
0 Related Data-Fields
There are no related data-fields


